UCORE ELECTRONICS UCE-DSO4200C User Manual Download Page 39


https://ucore-electronics.com 

38 


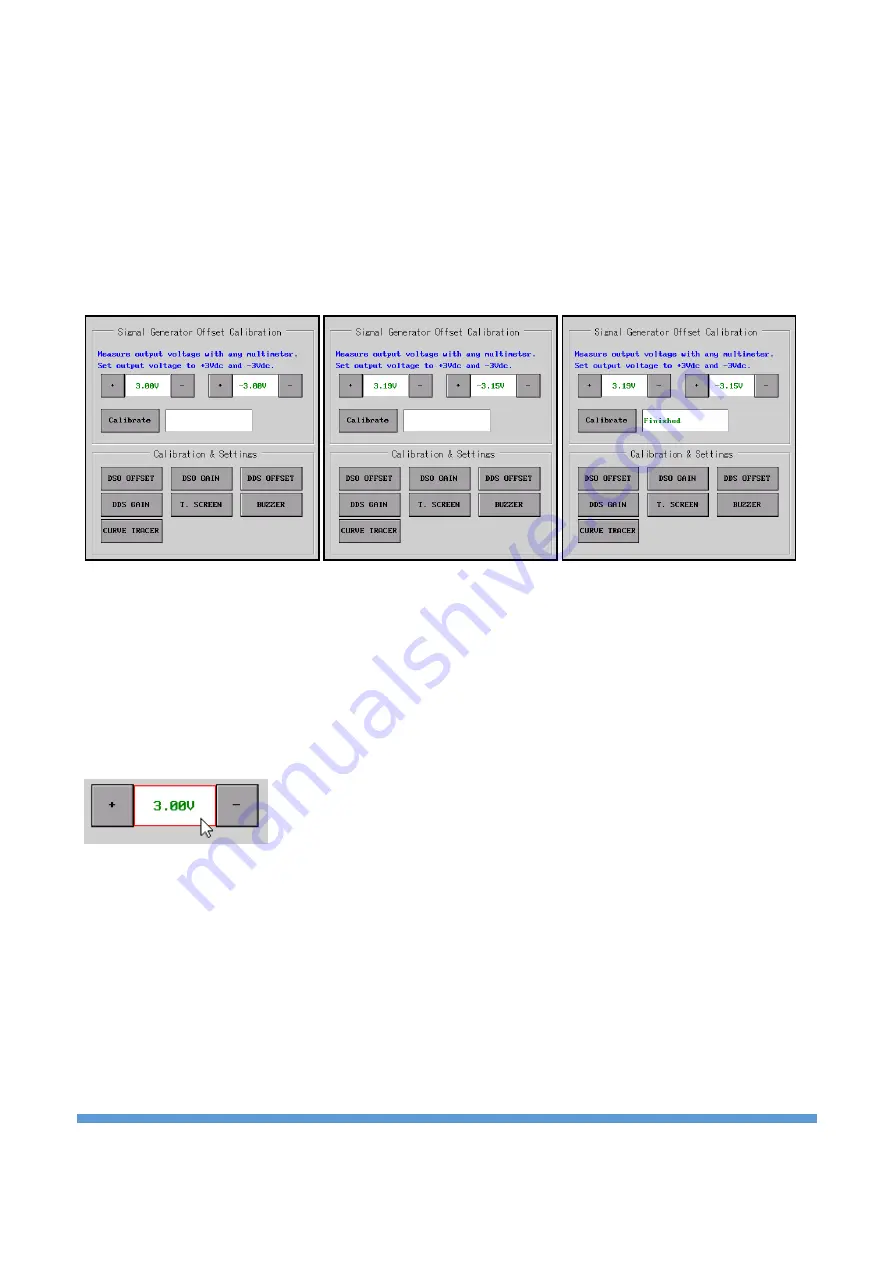
DDS OFFSET calibration: 

This calibration is done for the offset adjustment of the signal generator. To calibrate, first  click the 

DDS 

OFFSET

 button. In the submenu, an information message appears that the signal generator output (GEN) 

should be measured with a multimeter. 

In the submenu, there are two parameter settings as +3Vdc and -3Vdc. The left parameter is adjusted until 
the voltage measured on the multimeter (DC range) is 

+3.00V

. Then the right parameter is adjusted so that 

the  output is 

-3.00V

.  After the  adjustment process  is  completed, the calibration  process is completed  by 

clicking 

the “

Calibrate

” button.


The parameter can be adjusted in three different ways. 


By clicking 

the “

+

” and “

-

” buttons next to the parame

ters. 


By  turning  Rotary-1  for  +3V  and  Rotary-2  for  -3V  (Clockwise  turn  increases  the  value, 

counterclockwise decreases the value). 


If the mouse is active, when the cursor is placed on the parameter to be adjusted, the parameter is 

marked with a red frame. In this case, the parameter can be adjusted by turning the scroll. 


DDS GAIN calibration: 

This calibration is done for the gain adjustment of the signal generator. To calibrate, first click on the 

DDS 

GAIN

  button.  In  the  submenu,  an  information  message  appears  that  the  signal  generator  output  (GEN) 

should be measured with a multimeter.  

There  are  two  parameter  settings  in  the  submenu  as  3Vrms  and  1.5Vrms.  The  parameter  on  the  left  is 
adjusted until the voltage measured on the multimeter (AC range) is 

3.00Vrms

. Then the right parameter is 

adjusted so that the output is 

1.50Vrms

. After the adjustment process is completed, the calibration process 

is completed by clicking the “

Calibrate

” button. The 

fact that the multimeter to be used in the calibration 

has TRUE RMS will make the calibration more successful. 

Summary of Contents for UCE-DSO4200C

Page 1: ...UCE DSO4200C FAULT LOCATOR USER MANUAL UCORE ELECTRONICS https ucore electronics com 2023...

Page 2: ...15 4 Curve Tracer Mode 16 4 1 Before test 17 4 2 Theory 17 4 3 Setting test parameters 18 4 4 Menu usage 20 5 Signal Generator 23 5 1 Sine wave 24 5 2 Square wave 25 5 3 Triangle wave 25 5 4 Sawtooth...

Page 3: ...ystem info 36 9 3 LCD Back Light 36 9 4 Calibration Settings 36 10 PC Program 44 10 1 Oscilloscope menu 44 10 2 Signal generator 47 10 3 Curve tracer 48 10 3 1 Creating a database 52 10 3 2 Comparison...

Page 4: ...isassembly is ensured in troubleshooting In short circuit finder mode the short circuit line on the PCB can be analyzed and its location can be found Specifications Display 5 0 inch 800 480 pixel colo...

Page 5: ...Signal Generator Signals Sine square triangle sawtooth sinC noise exponential full wave half wave gauss direct staircase Max Voltage 5 0V 10Vpp Frequency 0 001Hz 20MHz Features of Curve Tracer Wavefo...

Page 6: ...easurement tips These are 4mm banana compatible probe inputs There is one BNC connector for signal generator output and 2 BNC connectors for oscilloscope measurement input Figure 1 Figure 1 Front view...

Page 7: ...om 6 Figure 2 Back and side views of the device When the device is turned on the main menu in Figure 3 is displayed There are 7 icons here These menus will be explained in detail in the next sections...

Page 8: ...iv value decreases CH 2 offset value increases CH 2 Volt div value increases CH 2 offset value decreases Pressing the button once will switch between Volt div and offset Curve Tracer Frequency value d...

Page 9: ...rating status time base mode trigger status information sampling status information time div frame refresh rate and battery status information are included On the right side there is the menu area whe...

Page 10: ...ed CH 1 enabled but not active CH 1 enabled and active Vertical scale setting Vertical scale indicates the voltage value per grid in the vertical axis of the screen It is often expressed in V div Whil...

Page 11: ...d Dec Offset buttons in the submenu of the CH 1 menu In addition when the Rst Offset button in the submenu is clicked the offset value is set to 0V Coupling adjustment The undesired signals can be fil...

Page 12: ...splayed stably In order to keep the observed signal constant on the screen the trigger source must be selected for that channel But only channel setting is not enough The trigger level should also be...

Page 13: ...hat it remains stable on the screen 3 4 Operations and measurements The device can perform math operations automatic measurements and cursor measurements on sampled and displayed data Mathematical ope...

Page 14: ...be calculated Vpp Peak to peak voltage value Vrms Effective voltage value Vavg Average voltage value When the relevant buttons in the submenu are clicked the selected measurement is added to the bott...

Page 15: ...As the cursors are moved the time values change in the upper right of the Screen In order to make the cursors passive the OFF button in the submenu is clicked Time measurement cursors active Voltage m...

Page 16: ...X axis represents time When the horizontal time base is greater than or equal to 25ms div the device enters slow scan mode XY mode In this mode both the X axis and Y axis represent voltage The mode ch...

Page 17: ...con At the top of the screen test voltage test frequency limit resistance and scanning period if scanning mode is active In addition to these frame refresh rate and battery status information are also...

Page 18: ...inductance and semiconductor Each of these components reacts differently to the applied AC test signal For this reason recognizing the four basic signatures on the oscilloscope display is a key to un...

Page 19: ...st current In order to limit the energy flow the maximum value of the test voltage is limited depending on the limit resistor Voltage limitation due to limit resistor 2V 1V for 10R range 7V 4V for 47R...

Page 20: ...requency can be adjusted between 20Hz and 10kHz It is adjusted in 10Hz steps between 20Hz and 200Hz in 100Hz steps between 200Hz and 1kHz and in 1kHz steps between 1kHz and 10kHz It consists of 36 lev...

Page 21: ...the Main Menu Also during this process the setting data is saved in the memory ct_settings cfg DUAL It allows simultaneous use of Probe 1 yellow color and Probe 2 red color channels If a single channe...

Page 22: ...CAN BTN becomes inactive and scan mode is disabled COMPARE Compares similarity of impedance curves between channels When the comparison is active the button is marked in green DUAL mode must also be e...

Page 23: ...warning when high voltage is detected in any of the channels during the measurement In this case the measurement must be terminated immediately Then the warning screen is touched to continue normal o...

Page 24: ...on Figure 11 Signal generator menu overview At the top left of the screen is the image of the waveform In the upper right parameter settings of the waveform are made At the bottom there are 16 buttons...

Page 25: ...ise the parameter increases by the value of the selected digit for example if the tens digit is selected the parameter setting is adjusted in ten steps If it is rotated counterclockwise the parameter...

Page 26: ...ycle value is changed the waveform changes accordingly on the screen Its adjustable range is between 5 and 95 Duty cycle 50 Duty cycle 10 5 3 Triangle wave Click the Triangle button for the triangle w...

Page 27: ...e adjustment methods see the explanations in the Sine wave section Positive sawtooth Negative sawtooth 5 5 SinC wave For the SinC wave the SinC button is clicked At this time you can set the parameter...

Page 28: ...ds see the explanations in the Sine wave section Positive exponential wave Negative exponential wave 5 8 Full wave rectification There are two different forms of full wave rectification positive and n...

Page 29: ...in the Sine wave section Positive half wave rectification Negative half wave rectification 5 10 Gaussian wave For Gaussian wave Gauss button is clicked At this time you can set the parameters for the...

Page 30: ...C is its ability to find the location of the short circuit It is useful in finding short circuits in defective electronic boards The menu is accessed by clicking the SHORT CIRCUIT icon in the Main Men...

Page 31: ...ircuit point the buzzer makes an intermittent sound At the short circuit point the buzzer sounds continuously Note Since low resistance values are measured here it should be noted that contact resista...

Page 32: ...king the USB DISK icon in the Main Menu the device is connected to the computer as a USB Disk USB HID connection is disconnected On the computer the device is listed in the Devices and drivers section...

Page 33: ...named Location and Files Files are listed in the Files section and the location of these files is also listed in the Location section The main disk directory is 0 Names starting with a slash in the F...

Page 34: ...ods of selecting a directory Clicking with the touch pen on one of the items listed in the Location menu Left click on the item if the mouse is actively using it Directory selection Open file or folde...

Page 35: ...deletes the item Device Settings folder The Device Settings folder in the 0 main directory is where the device settings files are saved ct_settings cfg file is in the curve tracer menu dds_settings c...

Page 36: ...ew By clicking on the EXIT button at the bottom right the main menu is returned The screen is basically divided into 5 zones About System info LCD Back Light Calibration Settings Calibration Settings...

Page 37: ...as possible 9 4 Calibration Settings Here calibration and some settings related to the device are made Factors such as heat dust and humidity reduce the performance of the device over time In such cas...

Page 38: ...alib CH 1 button Then the reference signal is applied to the CH 2 input and the calibration process is completed by clicking the Calib CH 2 button Important note As the frequency of the measured signa...

Page 39: ...ockwise turn increases the value counterclockwise decreases the value If the mouse is active when the cursor is placed on the parameter to be adjusted the parameter is marked with a red frame In this...

Page 40: ...e calibrating Clicking on the T SCREEN button opens the submenu related to the screen touch Clicking on the Test button in the submenu opens a screen on which drawings can be made Here it is decided w...

Page 41: ...button Buzzer has two different tones The Low Freq and High Freq buttons can be used to test low and high frequency tones The other two buttons are the settings for the buzzer to make a sound on touch...

Page 42: ...Vrms If the mouse is actively used adjustment can also be made by turning the scroll After the adjustment is made the NEXT button is clicked to proceed to the next step In the second stage the output...

Page 43: ...button becomes active Clicking the button will move to the next step In the 7th stage the open circuit impedance adjustment is made automatically When the stage is completed the NEXT button becomes a...

Page 44: ...l move to the next step In the 10th and last stage the calibration data is saved to the disk By clicking the SAVE button the data is saved and the calibration is completed Click the EXIT button to exi...

Page 45: ...abs on the left side of the screen Figure 16 Oscilloscope Signal Generator Curve Tracer About Figure 16 PC program Oscilloscope menu active In this section the use of the PC program will be briefly di...

Page 46: ...icking the parameter and clicking the desired coupling from the list The offset is adjusted in two different ways It can be adjusted by clicking the up and down arrows next to the offset parameter bel...

Page 47: ...ation It is possible to select three different operating modes by clicking the buttons here In Stop operation the position of the displayed waveform in the buffer is visible at the top of the screen B...

Page 48: ...ement is made Channel 1 or Channel 2 should be selected in the upper parameter If it is desired to measure in the X axis the second parameter is selected as Time channel selection does not affect In t...

Page 49: ...10 3 Curve tracer Click on the Curve Tracer tab on the left to open the curve tracer menu The screen consists of two parts On the left is the V I impedance curve and on the right is the menu area The...

Page 50: ...he Close button to close the window Save As When this button is clicked the impedance graph is saved to the computer in picture format bmp jpg png gif Figure 17 Advanced Mode It is the menu where oper...

Page 51: ...one position Load Image Opens a new window to load the visual of the electronic board to be tested Load Data Loads a database saved on disk to the list Save Data Saves the created database on disk Sel...

Page 52: ...green frame is formed Figure 19 If the Audible warning checkbox in the Advanced Mode tab is checked it gives a different sound warning in case of success and failure as a result of the comparison Figu...

Page 53: ...window cursor customization can be done Depending on the color and density of the PCB the color size and thickness of the cursor can be changed by the user There is also a magnifying screen The posit...

Page 54: ...from the list with the Delete button Or if you want to change the order in the list Move Up and Move Down buttons can be used The item can also be shifted by drag and drop method When the list is com...

Page 55: ...ceeds the tolerance limit the test fails and the color of the frame around the graph becomes red giving a warning with a different tone In this case the next point is not automatically passed In this...

Page 56: ...e and the PC program It contains version information of device and PC program software There is also a Check for updates button on the page When the button is clicked it is checked whether there is a...

Reviews: