


6
Measurements Displayed
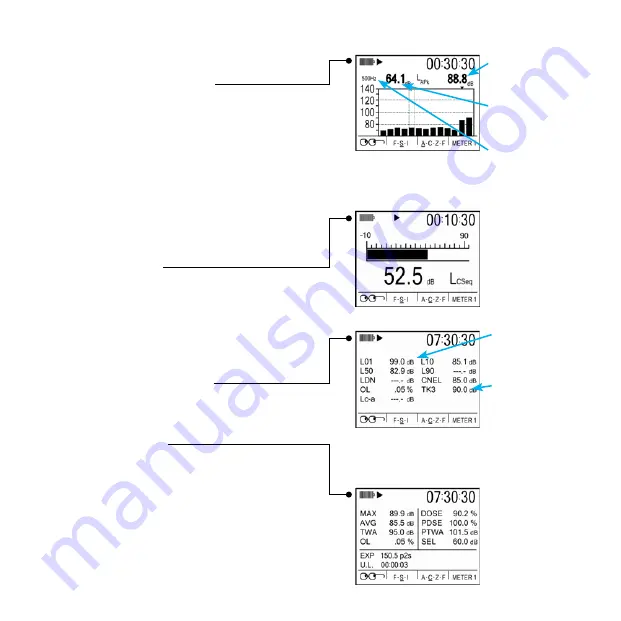
Filtered Bar Chart Screen
For the filtered bar chart screen, the dominant
characteristic of this screen is the multi-element
bar chart. The chart displays measurements in each
filter band and broadband values for both meters. For
octave band analysis, the screen contains 13 bars (11
for filters and 2 for broadband), and for third-octave
analysis the screen contains 35 bars (33 for filters
and 2 for broadband) of measurement values. The
bars appear (and usually fluctuate) if the measured
value for the bar is above the minimum value for the
selected measurement range.
Bar Chart Screen
For the
bar chart screen,
the amplitude of the
displayed measurement is shown both graphically
by the length of the bar and numerically below the
bar. The bar appears (and usually fluctuates) if the
measured value is above the minimum value for the
selected measurement range.
Community Noise Screen
This screen shows the results of measurements
commonly associated with community noise studies.
Dosimetry Screen
The Dosimetry screen provides several types
of measurements of the accumulated personal
exposure to noise.
Amplitude
in the Band
Shows SPL
average ampli-
tude (or value) of
Meter 1
+ Will display
only if SLM is
selected as the
measurement
mode.
Shows accumulated
personal exposure
to noise.
+ These measurements
are affected by the
settings in the
“Meter Set” screen
Only appears on Meter 1 when you are not viewing
the current study and when the community noise
parameters are activated.
Exceedance Levels
+ L1 = 99% dB
+ L10 = 85.1% dB
+ L50 = 82.9% dB
Taxtmaximal
+ Value is 90 dB at
3 sec. intervals
Selected
Band
Broadband
Amplitude
Shows SPL average amplitude (or value) of Meter 1
+ Will display only if octave band is enabled


