How to use TAM System Explorer
Scope
You can also move plots up and down by dragging their Y axis.
Use the center button to vertically center the selected plot.
The scope always activates the Y grid of the Y axis that the mouse hovered over last. The Y grid is also
adjusted when hovering over a plot in the plot list. This can be disabled by making a Y grid sticky with
the context menu of the axis as shown in Figure 9.
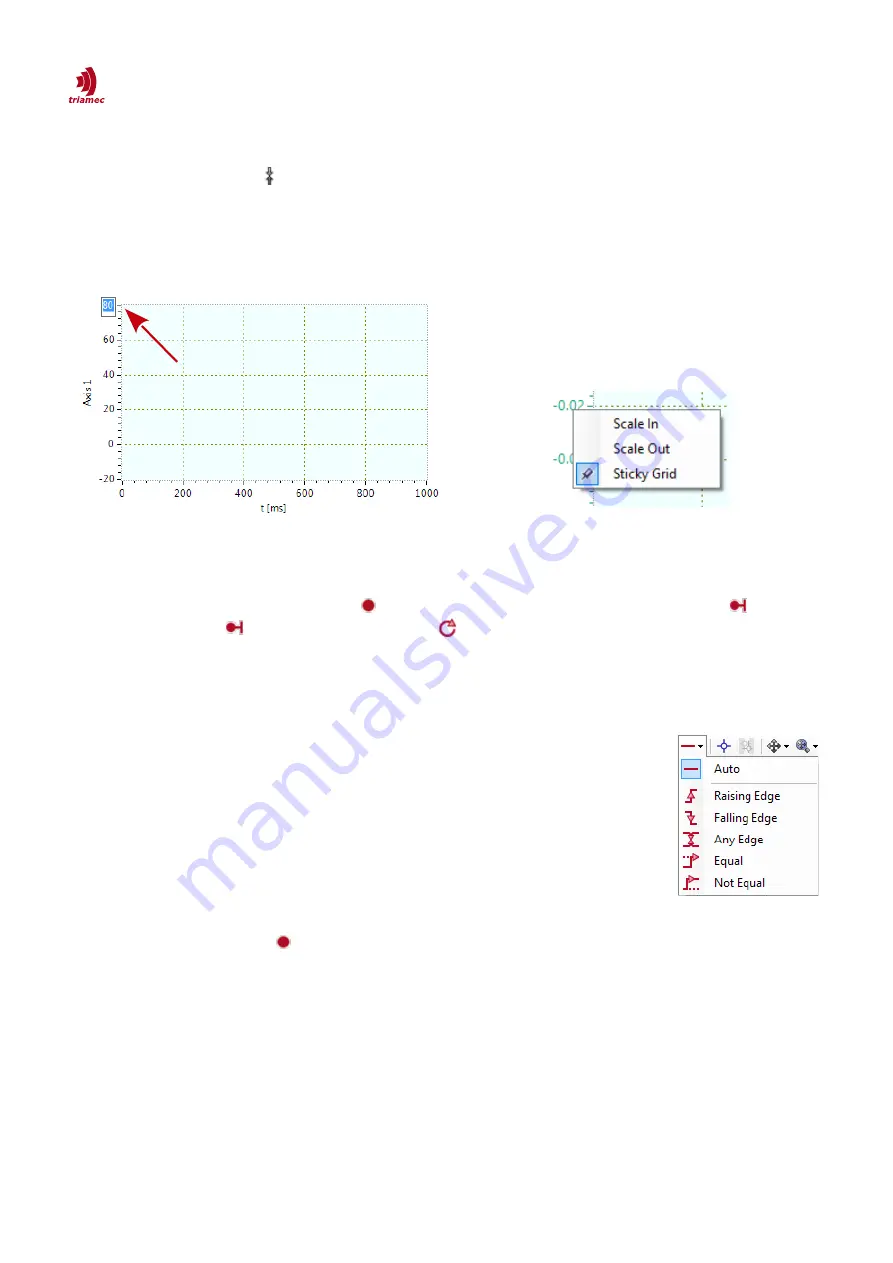
Figure 9: Y axis context menu items.
3.3.5 Triggering
To start scoping press the
Start
button . By default the scope is in single trigger mode . For auto-
matic triggering click to toggle to repeat mode or set the parameter
General > ScopeCharting
to
True
.
Signal trigger:
It is also possible to use a signal from the plot list as a trigger source. The following steps
are required to setup a signal trigger:
1. Select a trigger mode from the
Select triggers
pull-down menu (Figure 10):
2. Assign the trigger signal to the
Plot
property in the
Cursor
tab by selecting
the desired plot from pull-down menu
(see also Figure 13).
3. Set the desired trigger level to the
Level
property in the
Cursor
tab.
4. To define the pre-trigger and the post-trigger duration set
Axes > TimeAxis
> Range > Minimum/Maximum
in the
Plot
tab or click on the min/max la-
bel of the time axis (Figure 8).
5. The scope shows a red draggable cross-hair which can be used to set the
trigger level and the trigger time.
6. Press the
Start
button to activate the trigger.
ServoDrive-SetupGuide_EP018
2022-08-25
16
/
83
Figure 10: Trigger
mode.
Figure 8: Changing the Y axis range.


