

29
BA35ENG.DOC BA-35 Solar Quick Reference Guide
Pat Hatcher Revised: 05/08/00 1:13 PM Printed:
05/08/00 1:13 PM Page 29 of 38
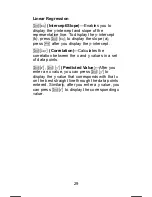
Linear Regression
0
{
(Intercept/Slope)—Enables you to
display the y-intercept and slope of the
representative line. To display the y-intercept
(b), press
0
{
; to display the slope (a),
press
w
after you display the y-intercept.
0
d
(Correlation)—Calculates the
correlation between the x and y values in a set
of data points.
0
T
,
0
Q
(Predicted Value)—After you
enter an x value, you can press
0
Q
to
display the y value that corresponds with that x
on the best straight line through the data points
entered. Similarly, after you enter a y value, you
can press
0
T
to display the corresponding x
value.


