30
Math Functions
% Q M
2
"
0
"
M z F T
4
" r
<
# # <
% ! "
0
J
"
2
<
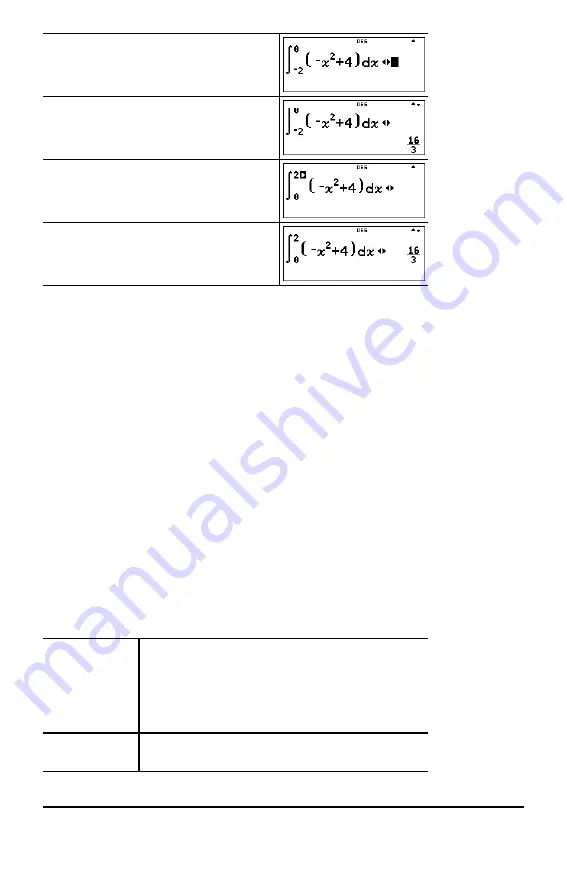
Notice that both areas are equal. Since this is a parabola with the vertex at (0,4) and
zeros at (
M
2,0) and (2,0) you see that the symmetric areas are equal.
Statistics, Regressions and Distributions
v
% u
v
lets you enter and edit the data lists. (See Data Editor section.)
% u
displays the
STAT-REG
menu, which has the following options.
Notes:
•
Regressions store the regression information, along with the 2-Var statistics for
the data, in StatVars (menu item 1).
•
A regression can be stored to either f(x) or g(x). The regression coefficients display
in full precision.
Important note about results:
Many of the regression equations share the same
variables
a
,
b
,
c
, and
d
. If you perform any regression calculation, the regression
calculation and the 2-Var statistics for that data are stored in the
StatVars
menu until
the next statistics or regression calculation. The results must be interpreted based on
which type of statistics or regression calculation was last performed. To help you
interpret correctly, the title bar reminds you of which calculation was last performed.
1:StatVars
Displays a secondary menu of the last computed
statistical result variables. Use
$
and
#
to locate
the desired variable, and press
<
to select it. If
you select this option before calculating 1-Var
stats, 2-Var stats, or any of the regressions, a
reminder appears.
2:1-VAR STATS
Analyses statistical data from 1 data set with 1
measured variable,
x
. Frequency data may be


