


Operation
6
SLUUBI1A – October 2016 – Revised July 2018
Copyright © 2016–2018, Texas Instruments Incorporated
bq34110EVM-796 Evaluation Module
3
Operation
This section provides instructions for operating the software.
3.1
Starting the Program
With the EV2400 and the bq34110EVM connected to the computer, run bqStudio from the Desktop or
installation directory. The initial window consists of a tools panel at the top and other child windows that
can be hidden, docked in various positions, or allowed to float as separate windows. When bqStudio first
starts up the
DashBoard
, the
Registers
, and
Commands
windows should be open. Additional windows can
be added by clicking the corresponding icons in the tools panel at the top of the main window.
The
Scan
(continuous scan) or
Refresh
(single time scan) buttons can be clicked in order to update the
data in the
Registers
and
Data Memory
windows.
bqStudio provides a logging function which logs selected Data Registers last received from the bq34110.
To enable this function, click the
Start Log
button. The default elapsed interval is 4000 milliseconds, to
change this interval, go to
Windows
, select
Preferences
, choose
Registers
, and change
Scan/Log Interval
from 4000 to 1000 milliseconds. There is no need to log faster than 1 second as the gauge will not update
the registers faster than 1 second.
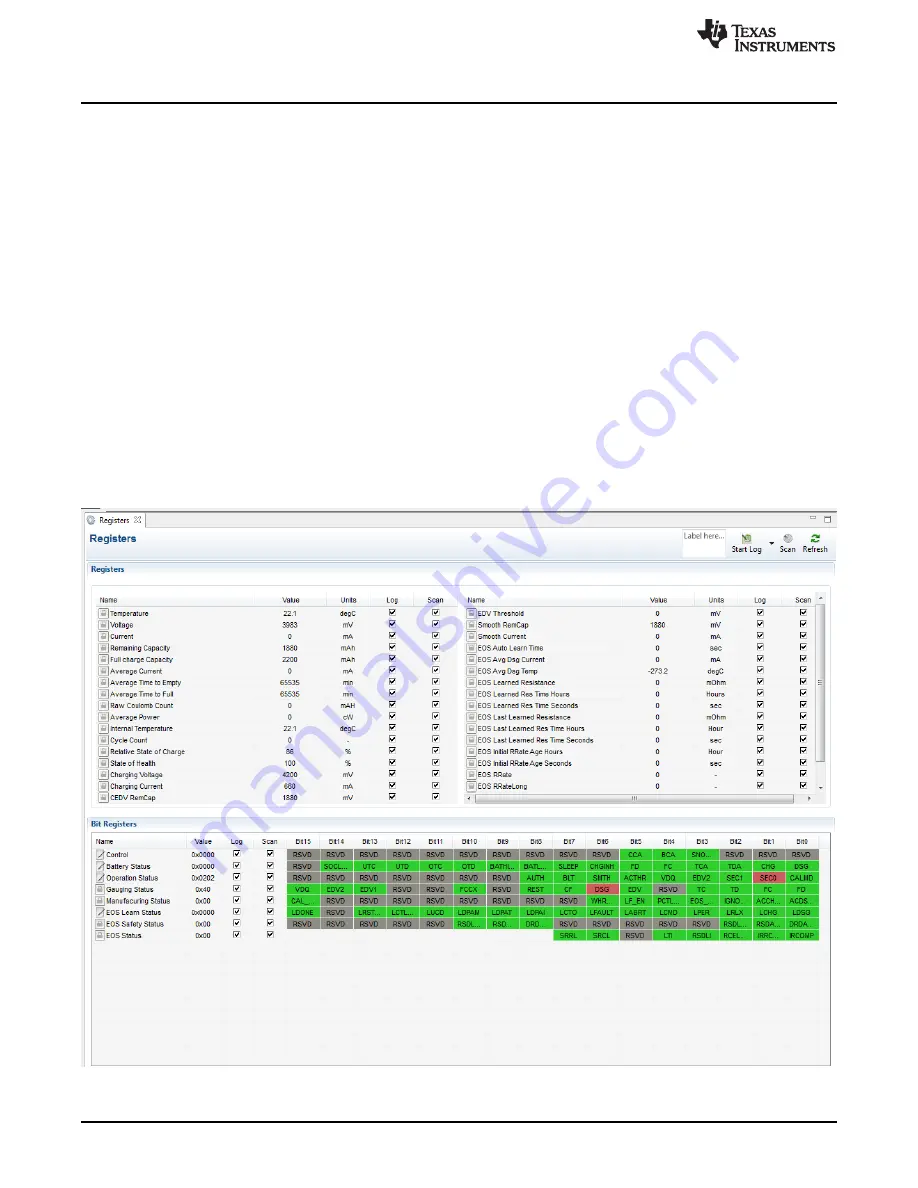
The
Registers
section contains parameters used to monitor gauging (see
). The
Bit Registers
section provides a bit-level picture of status and fault registers. A green flag indicates that the bit is 0 (low
state) and a red flag indicates that the bit is 1 (high state). Data begins to appear once the
Refresh
(single-time scan) button is selected, or it scans continuously if the
Scan
button is selected.
Figure 2. Registers Screen