72
Operation
SeaBat Sonar UI - User Manual
4.11.6 Detect
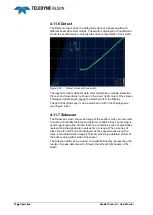
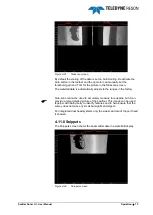
The Detect screen shows the bathymetry data of a single swath with
different beam data color modes. The swath is displayed in Zoom Extent
mode; the vertical scale is enlarged to enhance the details of the swath.
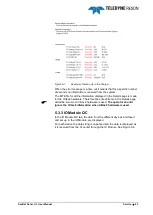
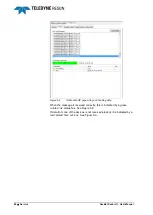
Figure 4-90
Detect screen with one swath
The legend for the multibeam data color mode(
Fixed
,
Quality
,
Detection
Process
and
Uncertainty
) is shown in the lower right corner of the screen.
This legend (Data Layer) cannot be switched off in the Display.
The grid lines (Grid Layer) can be switched on/off in the Display pane
(see Figure 4-49).
4.11.7 Sidescan
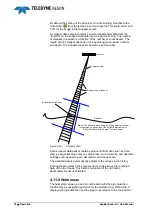
The Sidescan screen shows an image of the seafloor which can be used
to locate and identify features and bottom conditions. Each sonar ping is
used to generate a line of data. Each line contains a series of amplitudes
representing the signal return versus time or range. When a series of
these lines is combined and displayed as the vessel moves along the
track, a two-dimensional image is formed, providing a detailed picture of
the bottom along either side of the vessel.
The sidescan data can be viewed on a waterfall display representing the
results of a peak-detect search through the left and right beams of the
swath.


