background image

930536-00 Rev A

12

BASICS

Changing the Display

The grid is 8 Vertical divisions representing the full number of Vertical 

levels (at current resolution) and 10 Horizontal time divisions. The value 

represented by each division depends on the scale settings of the traces 

that appear on it.

8 Vertical 

Divisions
Full 

Vertical 

Levels

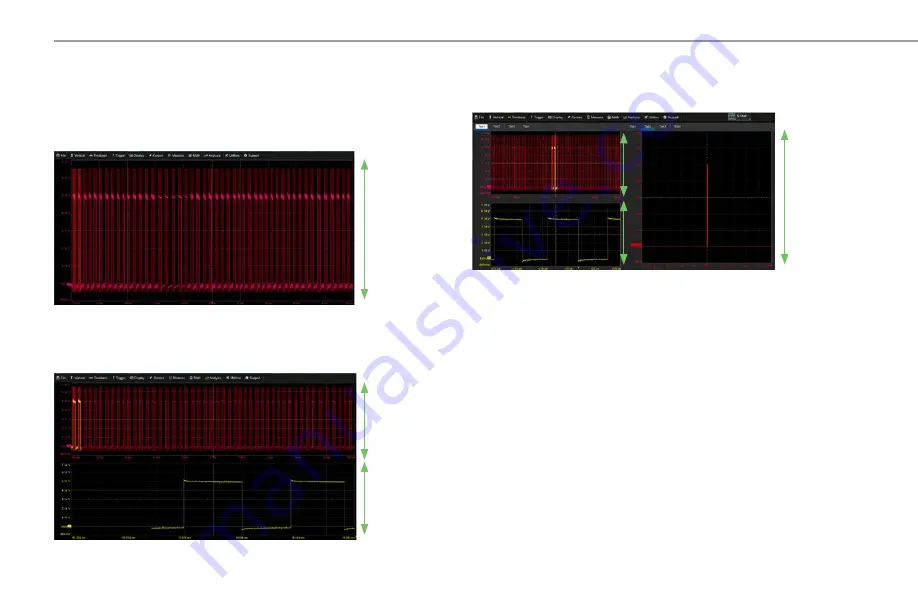
Multi-Grid Display 

The grid can be divided into multiple grids each representing the full 

number of Vertical levels. A variety of multi-grid modes are available.

Full 

Vertical 

Levels

Full 

Vertical 

Levels

Q-Scape Multi-Tab Display 

If you have installed the Q-Scape option, the grid area can be divided into 

multiple tabs. Each tab can show a single grid or a multi-grid mode.

Display Mode vs. Grid Mode 

The 

Display Mode

 determines whether the touch screen has a single display 

or tabs each representing a separate display. The 

Grid Mode

 allows selection 

of a particular grid style in each display. 
By default, the oscilloscope is in 

Normal 

Display Mode (a single display with 

no tabs) with the 

Auto

 Grid Mode enabled. 

Auto

 adds a grid for each new 

trace, up to 16 grids, until no more grids are available. Other grid modes 

create a fixed number and orientation of grids; the icon shows the result.
The various 

Q-Scape 

Display Modes divide the screen into tabbed displays. 

Many of the same grid functions you can perform in 

Normal

 mode, such as 

moving traces to other grids, you can also perform in the 

Q-Scape

 modes. 

To modify the touch screen display, choose 

Display > Display Setup

 from the 

menu bar and make your selections from the Display dialog.

8 Vertical 

Divisions
Full 

Vertical 

Levels

Summary of Contents for HDO9000

Page 1: ...HDO9000 Oscilloscopes Getting Started Guide ...

Page 2: ...ibute Teledyne LeCroy documentation for internal educational purposes Teledyne LeCroy is a trademark of Teledyne LeCroy Inc Other product or brand names are trademarks or requested trademarks of their respective holders Information in this publication supersedes all earlier versions Specifications are subject to change without notice 930536 00 Rev A January 2019 700 Chestnut Ridge Road Chestnut Ri...

Page 3: ...age on our website at teledynelecroy com support techlib Introduction Introducing HDO9000 Oscillosocopes 2 Safety 2 Overview Front of Oscilloscope 4 Powering On Off 5 Side of Oscilloscope 6 Connecting to External Devices Systems 7 Back of Oscilloscope 8 Front Panel 9 Touch Screen Display 10 Basics Changing the Display 12 Working with Traces 14 MAUI with OneTouch 15 Vertical Channel 20 Digital 22 H...

Page 4: ... the best ADC configuration for each measuring condition the HDO9000 always provides the optimal resolution HD1024 plus a low noise system architecture delivers superior signal fidelity up to 4 GHz resulting in ENOB in excess of 7 bits MAUI with OneTouch MAUI with OneTouch introduces a new paradigm for oscilloscope user experience Dramatically reduce set up time with revolutionary drag and drop ac...

Page 5: ...he instrument and the nearest object Keep the underside clear of papers and other objects Exercise care when lifting and carrying Unplug and use the built in carrying handle to move the instrument Do not remove the covers or inside parts Refer all maintenance to qualified service personnel Do not operate with suspected failures Check body and cables regularly If any part is damaged cease operation...

Page 6: ...OVERVIEW A B C E G H I F J D K A Capacitive Touch Screen Display B Front Panel C Power On Standby Button D Input Channels 1 4 E EXT In F AUX Out G USB 2 0 Port H Mixed Signal Interface I LBUS Port J Cal Out and Ground Terminals K Tilting Feet ...

Page 7: ...ION Do not change the Windows Power setting to System Standby or System Hibernate Doing so may cause failure OVERVIEW The touch screen display is the principal viewing and control center of the oscilloscope See p 10 for an overview of its components The front panel houses hard controls for different acquisition settings Operate the instrument using front panel controls touch screen controls or a m...

Page 8: ...930536 00 Rev A 6 Side of Oscilloscope A HDMI 1 4 and DisplayPort 2 0 Ports B USB 3 1 Gen 1 Ports 4 C Ethernet Ports 2 D Audio Mic and Speaker E USBTMC Port 1 for remote control A B C D E OVERVIEW ...

Page 9: ...nections from the Remote dialog and use the Windows networking dialogs to configure the device address Go to File File Sharing to configure email Remote Control You can control the instrument over a LAN using VICP TCP IP or VXI 11 LXI Use a standard ENET cable to connect to a network access point and be sure the instrument is on the same subnet as the controller You can also connect directly using...

Page 10: ...930536 00 Rev A 8 OVERVIEW A Built in Carrying Handle B Ref In and Ref Out to input output external Reference Clock C AC Power Inlet D Kensington Lock A B C D ...

Page 11: ... button enables disables HD1024 operation G The front panel Adjust knob changes the value in the highlighted data entry field when turned Pushing the Adjust knob toggles between coarse stepped or fine adjustments when the knob is turned All the knobs on the front panel function one way if turned and another if pushed like a button The first label describes the knob s principal turn action while th...

Page 12: ...t J Setup Dialogs Touch Screen Display The entire display is active Use your finger to touch drag and drop swipe pinch and flick Many controls that display information also work as buttons to access other functions If you have a mouse installed you can click anywhere you can touch to activate a control in fact you can alternate between clicking and touching whichever is convenient for you A B C D ...

Page 13: ...and detail as more are opened The Add New box sits next to the trace descriptor boxes Use it to turn on new traces or the Measure table See MAUI with OneTouch on p 15 Timebase and Trigger descriptor boxes appear at the right of the display Timebase and Trigger settings only apply to channel traces Touch the descriptor box to open the corresponding set up dialog Dialogs appear at the bottom of the ...

Page 14: ...Display Mode vs Grid Mode The Display Mode determines whether the touch screen has a single display or tabs each representing a separate display The Grid Mode allows selection of a particular grid style in each display By default the oscilloscope is in Normal Display Mode a single display with no tabs with the Auto Grid Mode enabled Auto adds a grid for each new trace up to 16 grids until no more ...

Page 15: ...move traces between displays Note When a Q Scape Display Mode is extended only Tab 1 is moved to the second display Line and Intensity The trace style can be set to a series of separate sample Points or a continuous vector Line Grid Intensity makes the grid lines dimmer or brighter relative to the trace When more data is available than can actually be displayed Trace Intensity helps to visualize s...

Page 16: ...aces Trace Descriptor Boxes Channel C1 C4 Zoom Z1 Z12 Math F1 F12 Memory M1 M12 and Digital Digital1 Digital4 descriptor boxes appear along the bottom of the grid area when a trace is turned on Descriptor boxes summarize activate arrange and configure the traces they represent Trace Context Menu The trace context menu is a quick way to apply math measurements or labels to traces To open the contex...

Page 17: ... with a white box When you re moving over invalid targets you ll see the Null symbol Ø under your finger tip or cursor Turn On To turn on a new channel math memory or zoom trace drag any descriptor box of the same type to the Add New box The next trace in the series will be added to the display at the default settings It is now the active trace If there is no descriptor box of the desired type on ...

Page 18: ...ce onto the target descriptor box You can also drop it on the Source field of the target setup dialog To change the source of a measurement drag and drop the descriptor box of the desired source onto the parameter Pn column of the Measure table You can do the same to a query Qn on the Pass Fail readout table To copy the setup of a measurement Pn drag and drop the source column onto the target colu...

Page 19: ...hange the trigger source channel drag and drop the desired channel Cn descriptor box onto the Trigger descriptor box The trigger will revert to the last trigger set on that channel To place horizontal cursors on zooms or other calculated traces where the Horizontal Scale has forced cursors off the grid drag the cursor readout from below the Timebase descriptor to the grid where you wish to place t...

Page 20: ...descriptor box onto the target memory Mn descriptor box Pan To pan a trace activate it to bring it to the forefront then drag the waveform trace right left or up down If it is the source of any other trace that trace will move as well To pan at an accelerated rate swipe the trace right left or up down Move Trace To move a trace to a different grid drag and drop the trace descriptor box onto the ta...

Page 21: ...the trace you want to zoom Touch the Zn descriptor box to open the zoom factor controls and adjust the zoom exactly To zoom in on any trace unpinch two fingers over the trace horizontally To zoom out on any trace pinch two fingers over the trace horizontally To turn off a trace flick the trace descriptor box toward the bottom of the screen BASICS ...

Page 22: ...ffset The front panel Volts knob also controls the Vertical Scale of zoom math and memory traces Channel Descriptor Box From the Front Panel Turn on activate channel trace and open set up dialog Raise lower Offset from zero Push to return to zero Offset Raise lower Volts div Push to toggle between coarse and fine scale adjustments Vertical Channel Gain Setting Offset Setting Pre Processing Summary...

Page 23: ...dd New box and choose Channel Touch new Cn descriptor to open the Cn setup dialog Enter Attenuation for passive and other vendors probes Enter Volts div and Offset Rescale channel trace or change Vertical Unit of grid Enter Coupling for cables probes Make any other Pre Processing settings Apply optional Bandwidth Filters ...

Page 24: ...ise lower group Vertical Position the top of lowest bit relative to center Turn Volts to raise lower Group Height the total Vertical divisions occupied by group Digital Descriptor Box Digital Displays Line trace shows high low and transition points for each line Bus trace collapses lines into hex values BASICS Digital Digital Memory Digital Lines in Group Digital Sample Rate Activity indicators sh...

Page 25: ...en the Digitaln setup dialog From the Touch Screen Choose Display Mode of individual lines bus trace or both Line Activity indicators show the state of each line high low or transitioning Optionally choose a new Label for the lines Select Custom to enter unique names Display buttons switch lead banks as you select lines Enter digital trace Vertical Position and Group Height in divisions Use checkb...

Page 26: ...r negative Delay time The front panel Time knob also controls the Horizontal Scale of zoom math and memory traces allowing you to zoom in to see more detail or zoom out to see the bigger picture BASICS From the Front Panel Raise lower trigger Delay Push to remove Delay Timebase Descriptor Box Samples Trigger Delay Position Time div Sample Rate Sampling Mode blank in real time Raise lower Time div ...

Page 27: ...the Touch Screen Touch the Timebase descriptor to open Timebase setup dialog Optionally enter Delay negative time before trigger or positive time after trigger event to show Select Sampling Mode Enter Time div Set To Zero removes Delay Lower number of Active Channels to increase sample rate and memory Turn on off HD Mode ...

Page 28: ...ease resolution When HD1024 is off the oscilloscope operates in continuous 8 bit resolution HD Summary dialog shows per channel Bandwidth due to combined manual bandwidth filters anti aliasing filters and coupling setting Bits resolution for which the ADC Configuration is optimized due to the Active Channels selection Bits resolution gained due to all the Optimized Filtering of bandwidth Total Res...

Page 29: ...y trace can be zoomed although Zoom is most useful for channel traces as it allows you to see the source at the original Timebase at the same time as the Zoom close up Zoom From the Touch Screen The Zoom descriptor box shows the Zoom Source and Horizontal Scale which differs from the Timebase Press to create Zooms of all open traces When Zoom button is lit use Horizontal Scale knob to change zoom ...

Page 30: ...are met unless postponed by a Holdoff count of time or number of trigger events Trigger types and modes are described at more length in the HDO9000 Oscilloscopes Operator s Manual From the Front Panel Trigger Descriptor Box Trigger Indicators Open Trigger setup dialog Trigger fired Trigger armed Turn to Raise lower trigger Volt Amp Level Push to Find Level Select Trigger Mode Auto trigger after pr...

Page 31: ...ch Trigger descriptor to open Trigger setup dialog Choose trigger Type Choose trigger Source channel Set trigger Level or Find Level based on the input signal Icon summarizes the trigger selections Set other conditions such as Coupling and Slope vary by trigger type ...

Page 32: ... two lines From the Front Panel From the Touch Screen Cursors Cursor Setup opens the Cursor dialog Touch and drag cursor to reposition measurement point Vertical Cursor readout on descriptor boxes Horizontal Cursor readout below Timebase Drag onto zooms to reset cursors on the rescaled traces Adjust cursor position Push to select different lines Choose Cursor Type Set exact Cursor Position using d...

Page 33: ...ific portion of the trace or plot a histogram trend or track of the measurement over time Measurements and Statistics Measure Measure Setup opens the Measure dialog Touch Measure column to re open Measure dialog if closed Pn dialogs to configure user defined measurement set Measure dialog to add remove Satistics and Histicons turn on Standard Measurements or Clear Sweeps Action buttons quickly plo...

Page 34: ...esult of applying a mathematical function e g Sum Product FFT to one or more source traces Operations can be chained by using one math function as a source for the other The math trace always opens in a separate grid from the source and can be viewed along side it One important distinction between math functions and measurement parameters is that the result of math is always another waveform where...

Page 35: ...12 Choose Math Memory Setup On the Mn tab select the trace you want stored in Copy From Waveform then touch Copy Now Optionally add Notes or Labels to the stored memory Then drag the descriptor box of the trace you want stored onto the new Mn descriptor box OR Touch the Add New box and choose Memory to turn on the next memory trace To store a new memory Internal memories persist only until the osc...

Page 36: ...ed patterns and events in the data stream BASICS Select Source trace and Protocol View decoding on the colored overlays When there is more data than fits in a table cell touch the white triangle to pop up the full decoding Touch data cells to zoom that single record of data The zoomed record is highlighted in the table and on the decode trace Touch drop down arrow in header to filter column When m...

Page 37: ...can modes similar to trigger setups enable a quick search for events of interest The results are time stamped tabulated and can be selected for individual viewing Color overlays mark events on the source trace BASICS Choose scan Mode event to find and Source trace to scan Select different views of the scan event table with without time stamps overlay or zoom Take action when an event is found such...

Page 38: ...sired frequency span and the oscilloscope automatically generates output in units relevant to the frequency domain A spectrogram generator displays 2D or 3D renderings of historical data BASICS Tabular readout of marker measurements 2D or 3D spectrogram shows history of spectra Use Peaks Markers dialog to mark and tabulate peaks or set measurement markers on frequencies Specify frequency span of i...

Page 39: ...d time stamped with either the absolute time since beginning of history or the time relative to where you are in the history Not only can individual acquisitions be restored to the grid you can replay history at varying speeds to capture detailed changes in the waveforms over time Select row of History table to view that acquisition BASICS View History table using absolute time or relative time Au...

Page 40: ... is networked LabNotebooks reports and other user data files can be emailed directly from the instrument or saved to accessible network devices Files can also be transferred to a USB drive through any of the host USB ports Stored user data files are located on the D drive Saving and Sharing Data Use the oscilloscope File menu options to save and recall data See the HDO9000 Oscilloscopes Operator s...

Page 41: ...de range of electrical telecom standards Software Options JITKIT HDO9K JITKIT makes it easy to understand the basic system jitter performance of clock signals and clock data activities through a wide variety of common jitter measurements Eye Doctor II HDO9K EYEDRII provides the channel emulation and de embedding tools for the next generation of serial data standards It seamlessly integrates into T...

Page 42: ...on Dynamic Calibration recalibrates the oscilloscope at start up and every time there is a change to any of the acquisition settings that directly affect the performance of the ADCs When one setup is calibrated at a particular ambient temperature the calibration is entered in a calibration table and reused for the duration of the session These calibration entries persist only for a single session ...

Page 43: ...ur last update Do not power down the oscilloscope at any point during the installation process Switching Users Windows 10 oscilloscopes only Windows 10 oscilloscopes are by default set to operate from the LeCroyUser account but you must run the oscilloscope from the Administrative User LCRYADMIN in order to change Windows settings run certain compliance packages or use LXI remote control Note To i...

Page 44: ...transit 5 Mark the outside of the box with the shipping address Add ATTN RMA code assigned by Teledyne LeCroy FRAGILE 6 If returning a product to a different country Mark the shipment Return of US manufactured goods for warranty repair recalibration List any cost of service in the Value column and the original purchase price For insurance purposes only Be very specific about the reason for shipmen...

Page 45: ...ration or difficulty of servicing the instrument Spare and replacement parts and repairs all have a 90 day warranty The instrument s firmware has been thoroughly tested and is presumed to be functional Nevertheless it is supplied without warranty of any kind covering detailed performance Products not made by Teledyne LeCroy are covered solely by the original manufacturer s warranty Support Online ...

Page 46: ...netic Field 3 Vrms 0 15 MHz 80 MHz EN 61000 4 11 2004 Mains Dips and Interruptions 0 1 cycle 70 25 cycles 0 250 cycles 4 5 1 To ensure compliance with all applicable EMC standards use high quality shielded interface cables 2 Emissions which exceed the levels required by this standard may occur when the instrument is connected to a test object 3 This product is intended for use in nonresidential ar...

Page 47: ...tents Safety Compliance EC DECLARATION OF CONFORMITY LOW VOLTAGE The oscilloscope meets intent of EC Directive 2014 35 EU for Product Safety Compliance was demonstrated to the following specifications as listed in the Official Journal of the European Communities EN 61010 1 2010 Safety requirements for electrical equipment for measurement control and laboratory use Part 1 General requirements EN 61...

Page 48: ... 2019 Teledyne LeCroy Inc All rights reserved 930536 00 Rev A January 2019 ...

Reviews: