

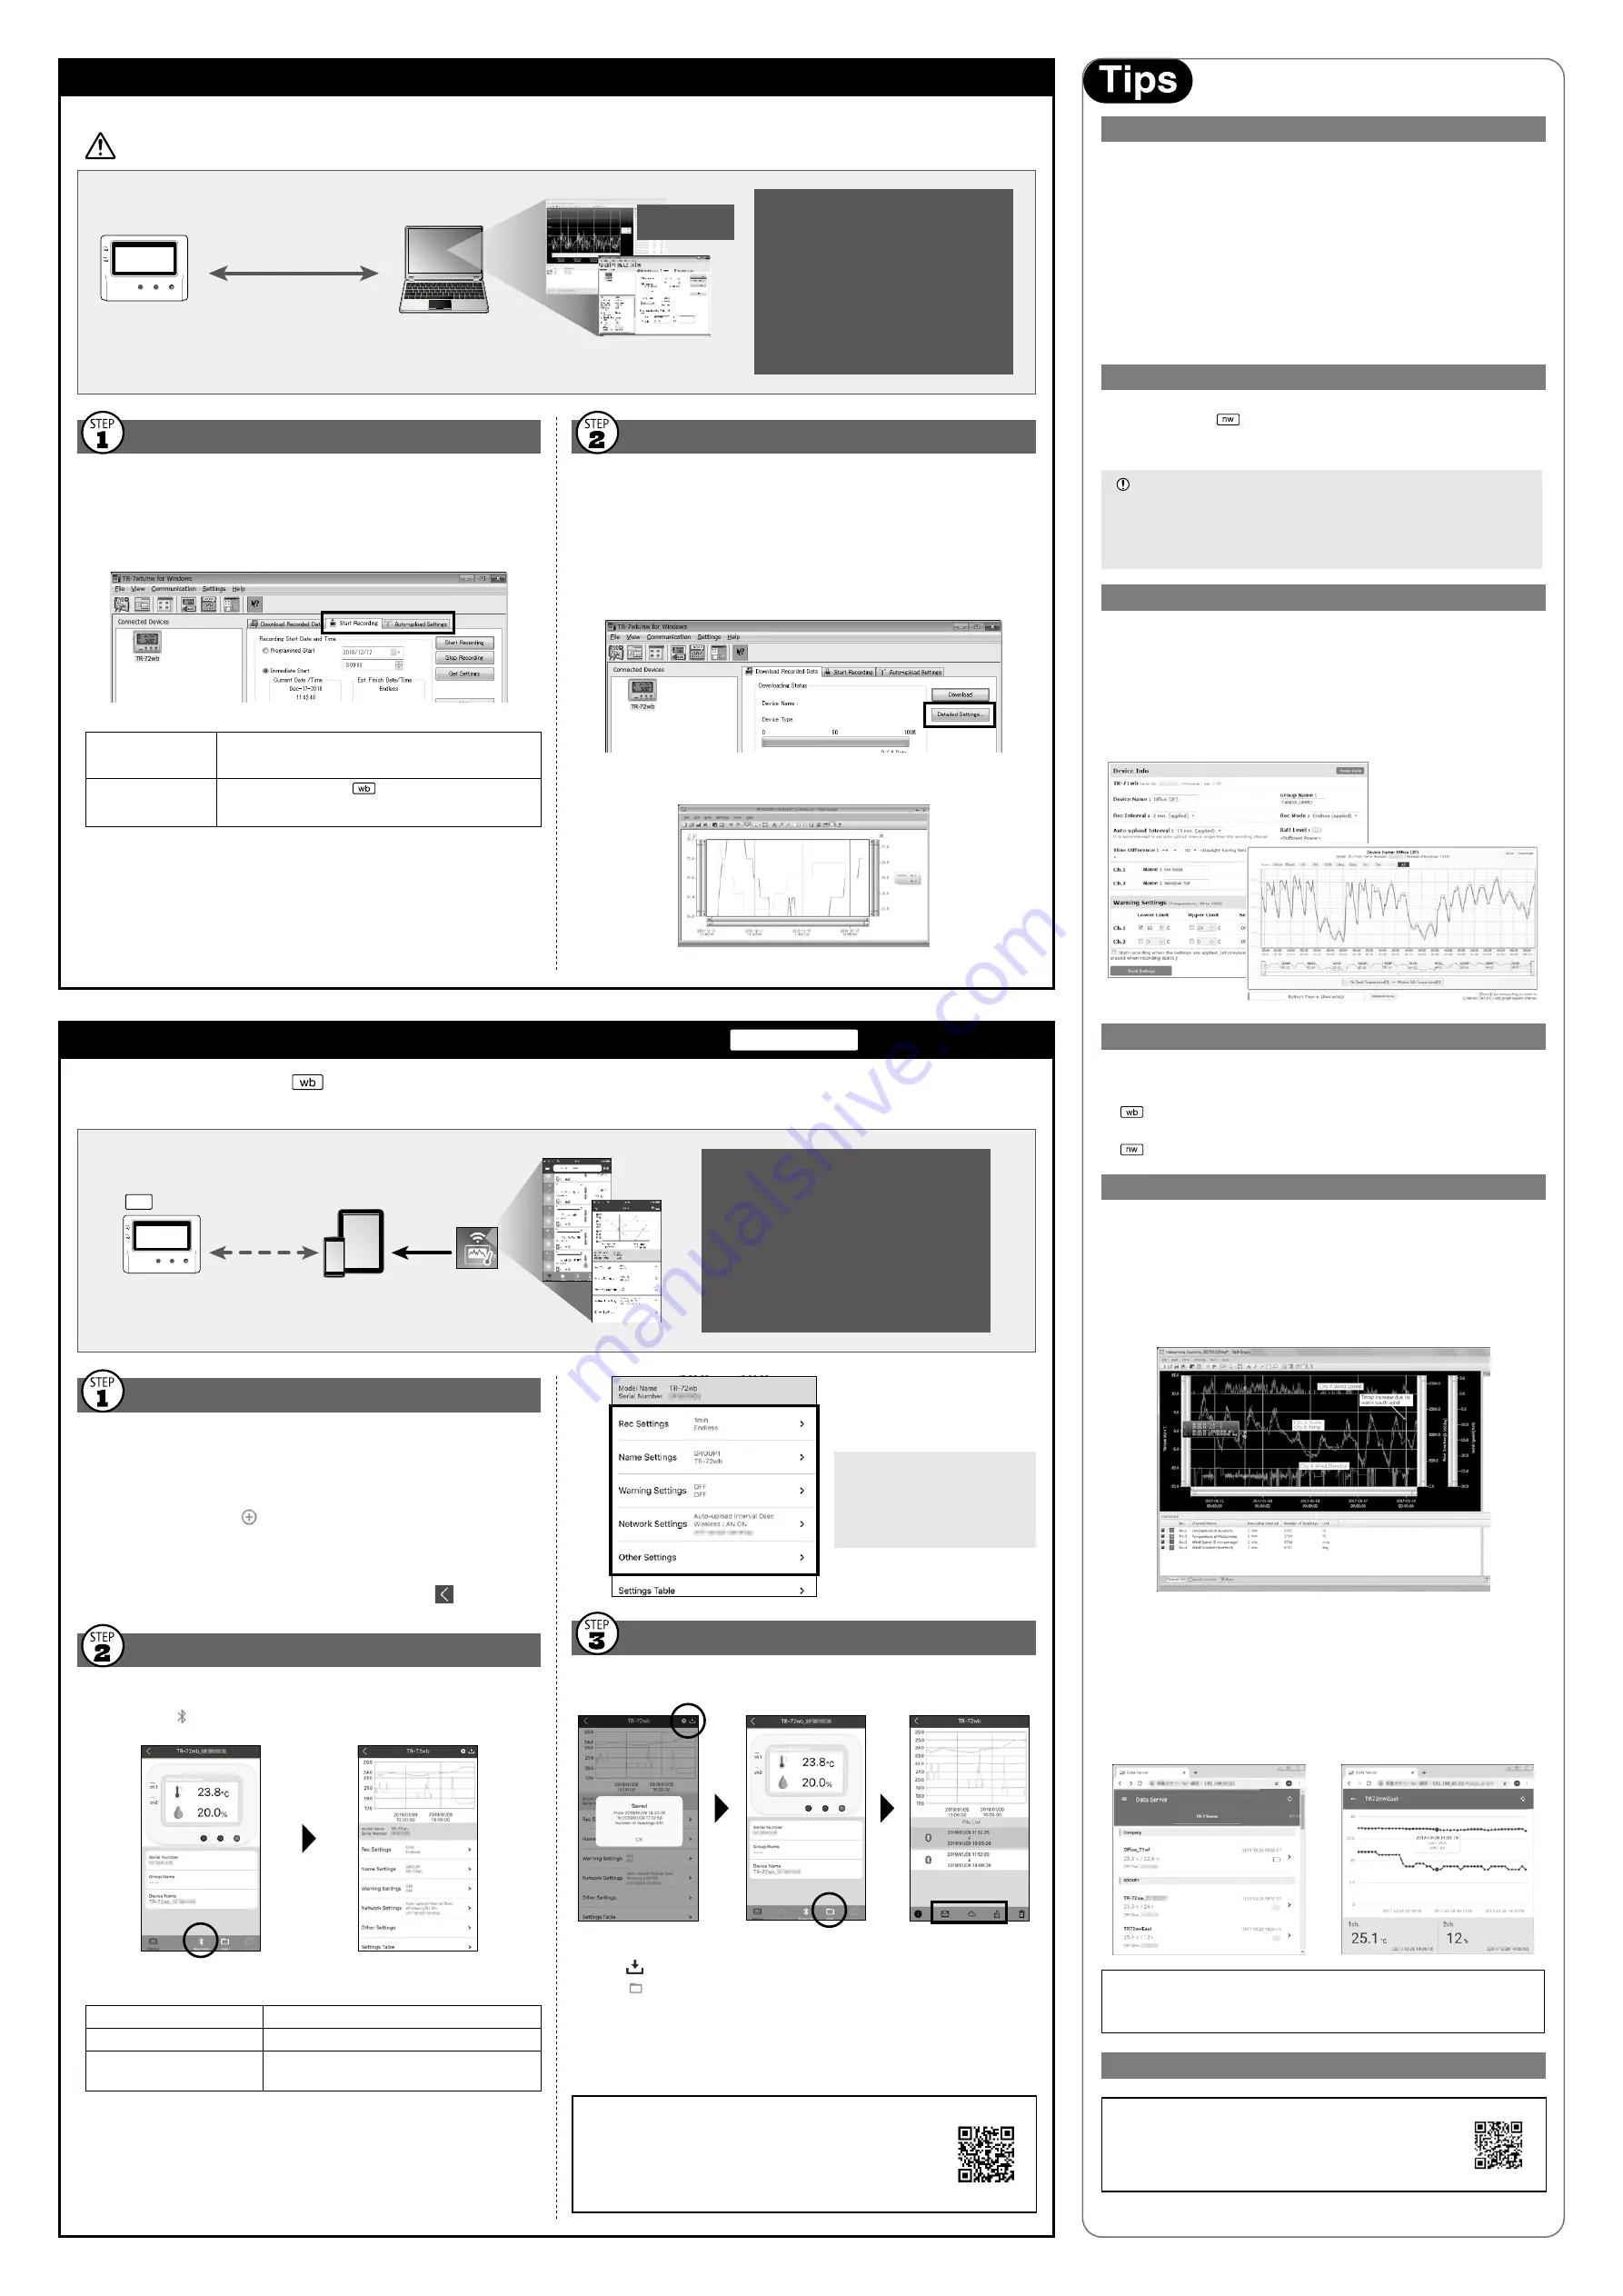
Using a USB connection between the logger and PC, make device settings and download recorded data via "TR-7wb/nw for Windows".
• The software can be downloaded from the T&D website, but for those who prefer, a CD and USB cable set (SO- 5C ) is available for purchase.
Device Settings
.
Download and install "TR-7wb/nw for Windows" from the URL shown above.
.
Connect the logger via USB to your computer.
* "TR-7wb/nw for Windows" will open automatically. (If not, please open it manually
from the Windows Start Menu or Start Screen.)
.
Make the necessary settings from the tabs in the main window.
Setting Items which can be set or changed:
[Start Recording] Tab
Programmed Start, Immediate Start, Recording Interval,
Recording Mode, Sensor Type (TR-75wb/75nw only),
Group
Name, Device Name, Channel Name
[Auto-upload Settings]
Tab
Network Settings (DHCP,
Wireless LAN Settings),
Warning Settings, Time Settings, Data Destination, Upload
Interval
.
After having completed all the settings, click [Start Recording] or [Send
Settings] to send the setting contents to the logger.
Device Registration
.
Install "T&D Thermo" to your smartphone or tablet.
* "T&D Thermo" is available on the Apple Store for iOS devices and the Google Play
Store for Android devices.
.
Open the app.
.
On the top screen, tap [
Add] to open the Add Device screen.
.
By selecting the desired device in the list of Nearby Bluetooth Devices, its
serial number will be entered automatically. Enter the registration code
manually, then tap [Apply].
5.
Repeat the same for all devices you wish to add, then tap
to return to
the top screen.
Graph Display and Device Settings
.
Tap the device in the list to open the device info screen.
.
By tapping [
Bluetooth] in the tab bar, the device settings screen will
open and display downloaded data in graph.
Device Info
Graph/Device Settings
Graph Operations
Zooming in and out
Pinch in/out to change the scale.
Full screen display
Hold the smartphone horizontally.
Checking time and tempera-
ture at the specified point
Tap and hold on the graph (in full-screen mode).
Sensors
Optional Sensors
We offer a wide range of Temperature and Temperature-Humidity sensors,
sensor extension cables, AC adaptors, etc. For details see the Optional
Products information on the Product Page.
tandd.com/product/tr7wbnw_series.html
Thermocouple Sensors (for TR-75wb/75nw)
We do not handle the sale of Thermocouple sensors. Please purchase
separately.
External Power Supply
It is possible to use USB bus power, AC adaptor (AD-05A2 or AD-05C2: sold
separately), or PoE (
only) as a power source. When using an external
power supply, installing batteries will make it possible to continue recording
in the event of a power outage.
Important Notice for Using an External Power Supply
When using external power, the data logger itself generates heat and the internal
sensor of the TR-71wb/71nw will report a higher temperature than actual; we
recommend using an external temperature sensor.
Also, when an external sensor is used near the TR-7wb/nw Series, it may be
affected by the heat from the logger.
T&D WebStorage Service
"T&D WebStorage Service" is a free web-based cloud storage service pro-
vided by T&D Corporation. By uploading recorded data to
"T&D WebStorage Service", it is possible to access your important data from
anyplace in the world at any time you wish.
https://webstorage-service.com
Useful features include automatic transmission of current readings & recorded data, graph dis-
play, settings, etc.
Time Settings
The time difference setting can be changed via "T&D WebStorage Service",
"TR-7wb/nw for Windows", or "T&D Thermo". The default time difference is
as follows:
GMT +1:00 (for serial number "No.4XXXXXXX")
GMT -8:00 (for serial number "No.3XXXXXXX")
GMT +0:00 (for all serial numbers)
Software for TR-7wb/nw Series
T&D Graph
"T&D Graph" is a software program which enables the viewing of recorded
data in graph form, whether the data is stored on a local computer or at
"T&D WebStorage Service". Even if the data you wish to view is divided into
multiple files, it is possible to merge them into one graph by specifying the
device name and/or time period. The graph data can be saved as a graph file
(.trg) or a text file (csv).
T&D Data Server
The PC on which "T&D Data Server" has been installed can act as a server
which receives and stores data recorded by TR-7wb/nw Series data loggers to
the user-specified folders. The stored data can be viewed in graph from using
"T&D Graph" or monitored using a web browser. When you wish to have
recorded data automatically uploaded to your server rather than
"T&D WebStorage Service", please use this software.
Monitoring / Graph Window
T&D Software and Applications Available for Free Download:
tandd.com/software/
Product Support
Please contact your local distributor.
tandd.com/purchasing/
Downloading Data and Viewing in Graph
By using "T&D Graph", it is possible to view data downloaded from the logger in
graph form.
.
Download and install "T&D Graph" from the URL shown above.
.
Connect the logger via USB to your computer.
.
Open "TR-7wb/nw for Windows", click the [Download Recorded Data] tab
and proceed with the download.
* Before downloading, settings for "Graph Display" and "File Name" can be viewed and
changed under [Detailed Settings].
.
Upon completion of the download, "T&D Graph" will open and display the
graph.
* For details about software operations, please see the "Help" menu in each software.
Primary features of
"TR-7wb/nw for Windows" include :
• Start/Stop Recording
• Auto-upload Setting
• Network Settings (static IP address, etc.)
• Name Settings (device/group/channel)
• Downloading and Saving Recorded Data
• Warning Settings
• Time Settings
• Sensor Type Setting (TR-75wb/75nw only)
PC
USB Connection
(Setup and Data Download)
"T&D Graph"
Save / Analyze
Software Download (free) >> tandd.com/software/
Primary features of "T&D Thermo" include :
• Start/Stop Recording
• Auto-upload Interval Setting
• Name Settings (device/group/channel)
• Warning Settings
• Graph Display
• Downloading, Saving and Uploading Recorded
Data
• Network Settings
• Time Settings
Smartphone
Tablet
Bluetooth
(Bluetooth low energy)
Install
T&D Thermo
wb
By using the "T&D Thermo" App with
, it is possible to make device settings, download recorded data, and view recorded data directly from your smartphone or
tablet via Bluetooth. The app supports Android OS and iOS.
Beneath the graph is the device
settings area where you can
change recording settings, name
settings, warning settings,
network settings, security settings,
etc...
Saving and Sharing Recorded Data
Data downloaded can be saved to a file and shared by using
"T&D WebStorage Service" whenever needed.
Back
Device Info
Graph/Device Settings
File List
.
Tap [ Save] at the upper right of the graph to save graph data.
.
Tap [
Files] in the tab bar at the bottom of the device info screen to open
the file list.
.
Select a file and tap the desired icon in the toolbar.
*
The icons in the toolbar allow you to take actions on the selected data file such as
sending to "T&D WebStorage Service", sending via email, sharing in SNS and saving
directly to your smartphone.
For details about "T&D Thermo", refer to the online
help.
tandd.co.jp/support/webhelp/tdthermo/eng/
Smartphone over Bluetooth
®
: Setup and Download
TR-7wb Series
PC over USB: Setup and Download


