background image


59 

     SVANTEK 974 User Manual 
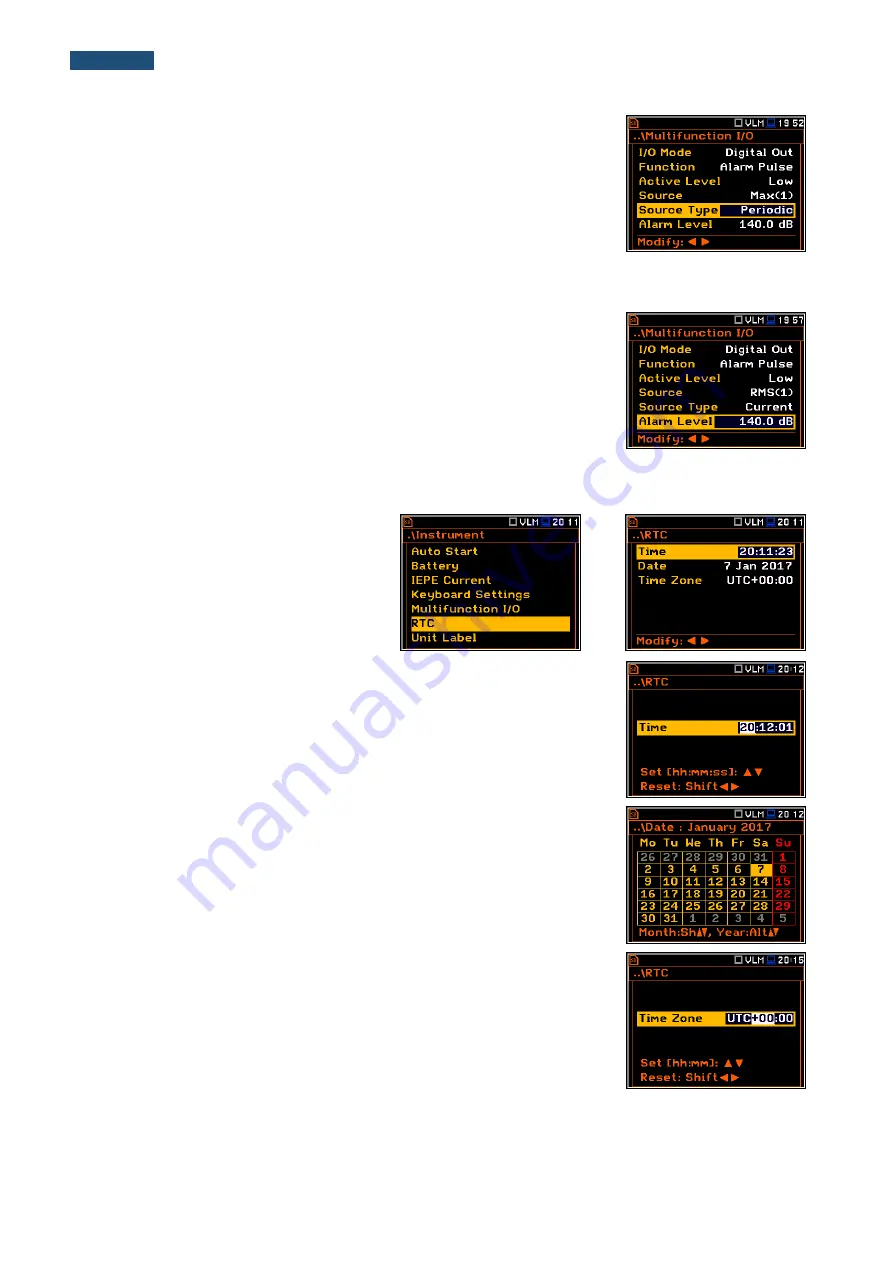
Alarm source type 

The 

Source Type 

position enables the user to select the type of alarm source. 

Available types are: 

Current 

and 

Periodic

.  

In  case  of 

Current

,  the  alarm  pulse  will  be  generated  all  time  when  the 

instantaneous result of the function selected in the 

Source

 position (measured 

with 1 second step) is over the 

Alarm Level

 value.  

In case of 

Periodic

, the alarm pulse will be generated all time when the result 

of  the  function  selected  in  the 

Source

  position  and  measured  with  the 

integration period step, is over the 

Alarm Level

 value. 


Alarm level  

The 

Alarm Level 

position


enables the user to set the level of the result to be 

monitored  during  the  measurements.  If  the  result  is  greater  than  the  alarm 
level, the instrument will generate the alarm signal in the selected logic. The 
available levels are within the range [60.0 dB, 180 dB]. 


8.6. 

 Setting up the 

instrument’s internal Real Time Clock – RTC 

The 

RTC

  position  enables  the  user  to 

programme  the  internal 

Real Time Clock

This  clock  is  displayed  in  the  different 
places  of  the  display  depending  on  the 
selected view mode. 

 <ENT> 


The  required 

Time

  (hour,  minute  and  second)  can  be  selected  in  a  special 

window, which is opened by means of the 

◄ or ► push-buttons.  

To  set  hours,  minutes  or  seconds  the  user  should  enter  the  relevant  field 
position by pressing the 

◄ or ► push button and then select the correct value 

by  means  of  the 

▲  or  ▼  push-buttons.  To  confirm  the  selection  the  user 

should press the 

<ENTER>

 push-button. 


The required 

Date

 can be selected in a special window, which is opened after 

pressing the 

◄ or ► push-buttons when the 

Date

 text is displayed inversely 

in the 

Timer

 sub-list.  

To set the correct date, the user should select its position in the calendar by 
means of the 

◄, ► or ▲,▼ push buttons and then press 

<ENTER>

 to confirm 

the selection.  


Time Zone

 can be selected in a special window, which is opened by means 

of the 

◄ or ► push-buttons.  


Summary of Contents for SVAN 974

Page 1: ...USER MANUAL SVAN 974 VIBRATION ANALYSER Warsaw 2017 03 26 Rev 1 01 Copyright 2017 SVANTEK All rights reserved ...

Page 2: ...k Sp z o o All rights reserved Reproduction without permission is prohibited Trademarks Trademarks or registered marks in this manual belong to their respective manufacturers Disclaimer Information in this document is subject to change without notice and does not represent a commitment on the part of Svantek Svantek provides this document as is without warranty of any kind either expressed or impl...

Page 3: ...surement Function 23 4 3 Instrument s calibration Calibration 24 4 3 1 System Check 24 4 3 2 Calibration by Sensitivity 25 4 3 3 Calibration By Measurement 25 4 3 4 History of performed calibrations Calibration History 26 4 3 5 Clearing calibration records Clear Calibr History 27 4 3 6 Post measurement calibration Post Calibration 27 5 SETTING UP THE MEASUREMENT Measurement 28 5 1 Setting up the m...

Page 4: ...ng information about files Info 54 7 2 Managing the setup files Setup Manager 54 8 SETTING UP THE HARDWARE PARAMETERS Instrument 56 8 1 Measurement auto start Auto Start 56 8 2 Checking the instrument powering Battery 56 8 3 Selection of the IEPE current supply IEPE Current 57 8 4 Programming the keyboard Keyboard Settings 57 8 5 Setting up the parameters of the I O port Multifunction I O 57 8 6 S...

Page 5: ...ting up the parameters of FFT analysis FFT 71 11 3 Saving the FFT spectra as a time history Logger Results 72 11 4 Setting up the FFT spectra view 72 11 4 1 Presentation of FFT spectra 73 11 4 2 Setting up the scale of spectrum plot Scale 74 11 4 3 Selection of the spectra to be viewed Spectrum View 75 11 4 4 Selection of the spectrum type Spectrum Type 75 12 MAINTENANCE 76 12 1 Powering the instr...

Page 6: ...on the SD card is available as an option and advanced trigger and alarm functions are available in the standard version of this instrument A fast USB 1 1 interface 12 MHz creates a real time link for the PC front end application of the SVAN 974 instrument The measurement results can be downloaded to PC using all the interfaces mentioned above The instrument is powered from four AA standard alkalin...

Page 7: ...can be purchased at any time as only the introduction of a special unlock code is required for their activation in a specific instrument Contact your local Svantek distributor for further information and costs for these options 1 6 General parameters Input IEPE Charge amplifier or Direct with TNC connector IEPE Current Selectable 1 5 mA 3 0 mA 4 5 mA Dynamic Range More than 100 dB in single range ...

Page 8: ...d and released before pressing the second one or pressed in parallel while operating in 2nd Fun mode see the following notice with the second push button one finger operation The Shift push button pressed in conjunction with Alt enables the user to activate the Markers on the plots during the measurement Alt This push button enables the user to choose the third push button function in case of Save...

Page 9: ... select the column in a multi column parameter list select the parameters value in an active position e g Start Delay period 1s 2s 3s etc control the cursor in Spectrum and Logger modes of result presentation select the position of the character in the text editing screen activate markers 2 and 3 speed up changing the numerical values of the parameters when pressed and held The or push buttons pre...

Page 10: ...ble markers appear on the screen To switch on marker number 1 the user must press push button number 2 number 3 and number 4 Active marker number will be highlighted To switch off the marker the user should press the appropriate arrow button second time The markers disappear from the screen after pressing Shift and Alt but the status of markers doesn t change To continue working with the markers t...

Page 11: ...laced from the right to the left as follows I O and USB The USB socket is the USB Device 1 1 interface a serial interface working with 12 MHz clock Thanks to its speed it is widely used in all PCs In the instrument the standard 4 pin socket is used The additional multi purpose input output socket called I O is a 3 5 mm jack socket On this socket in case when the Analogue Output functionality is se...

Page 12: ...e main list is opened after pressing the Menu push button This list contains the following sub lists Function Measurement Display File Instrument and Auxiliary Setup Recent Items list Double pressing the Menu push button opens the list of recently accessed menu items This enables the user to access the most frequently used lists quickly without the necessity of passing through the whole menu path ...

Page 13: ... values in the same line by means of or with Shift Complex parameters Some parameters like Start Hour Start Day etc are complex consisting of more than one value field The selection of values for such parameters is performed in a special window which is opened with the or push buttons In the special window the value is selected with the or or or push buttons and then confirmed by pressing ENTER In...

Page 14: ...of the character in the edited text using the or push buttons The user can insert or delete the position in the edited text using the or push buttons pressed together with Alt Alt The user can change the character of the selected position with the use of virtual keyboard with available ASCII characters To make a keyboard active the user should press the or push button To insert new character to th...

Page 15: ...switch the instrument on the Low Battery message occurs on the display for 2 seconds and the instrument switches off by itself A fully charged set of 4 batteries ensures more than 12 hours of continuous operation of the instrument with display Dim switched on The battery condition can be checked by means of the Battery function It is also presented continuously on the top line of the display by me...

Page 16: ...ay change but always return to them with the use of Factory Settings option in the Auxiliary Setup menu Next chapters of the manual will describe in detail what each parameter means and how to change the instrument settings Main default settings With default settings the instrument will measure vibration level by virtual meters so called profiles Measurement Mode Acceler IEPE Measurement Function ...

Page 17: ...urement is running memory warning icon is displayed when there is no SD memory card inserted stop icon is displayed when the measurement is stopped SD Card icon is displayed when the micro SD card memory is inserted pause icon is displayed when the measurement is paused computer icon is displayed when there is a successful USB connection with the PC clock icon is displayed when the timer is On It ...

Page 18: ...vailable measurement results and settings can be stored in the memory micro SD Card as files in the predefined or assigned directories The setup files are stored in the predefined directory SETUP The predefined directories can be changed by the user or renamed The SD Card memory is activated automatically after insertion of the card The SD Card icon is displayed when the micro SD card memory is in...

Page 19: ...ix of files the user has created and saved in the working directory and is equal to the maximum number of these files So the next saved file will always have a number higher than the counter The user can change the automatically generated file name in the special screen which is opened after pressing the or push buttons If the user changes number of the name the instrument will accept only that na...

Page 20: ...off in the Logger Setup list path Menu Measurement Logging Logger Setup the automatic saving of result data so called Summary Results is switched off too In such a case Summary Results can be saved only manually or Note If Logger is Off the field with file name is empty There are two options for saving manually Summary Results data One option is to press Save push button Alt ENTER right after the ...

Page 21: ...easurement Logging Wave Recording Wave Rec Continuous or On Trigger The wave file name is defined automatically using the same rules as for the logger files The default prefix for the wave files is R Note During the measurement run with wave recording to the wave file the note icon is displayed Note The wave files usually are big in size and may use enormous memory space Since the wave name is not...

Page 22: ...nal standards and methods For more complex tasks the user has the possibility of expanding the basic functions of the instrument with additional functions These features include 1 1 and 1 3 octave analyzer signal recording and others If additional functions were not supplied in the instrument kit and were not unblocked by supplier such a task is in respomsibility of the user who decides to buy add...

Page 23: ...ns These functions extend the main Level Meter functionality of the instrument because the selected 1 1 and 1 3 octave analysis is performed together with all calculations of Level Meter To select the required function the user should enter the Measurement Function list After entering the Measurement Function list the list of the available functions appears on the display Level Meter 1 1 Octave 1 ...

Page 24: ... the calibration result are expressed in different units depending on the settings of the instrument The metric or non metric Vibration units are set in the Vibration Units window path Menu Auxiliary Setup Vibration Units Additionally the linear or logarithmic units are set in the Display Scale window path Menu Display Display Scale Note It is not possible to check and calibrate the instrument dur...

Page 25: ...ton 2 Set the sensitivity of the accelerometer taken from its calibration certificate using the Shift with or push buttons The calibration factor is calculated every time after pressing the or push buttons in relation to the nominal value of 10 0 mV ms 2 To confirm the new calibration factor press ENTER For an accelerometer with sensitivity higher than 10 0 mV ms 2 the calibration factor will alwa...

Page 26: ...t a few times to ensure the integrity of the calibration The obtained results should be almost identical with 0 1 dB difference Some possible reasons for unstable results are as follows the accelerometer is not properly attached to the calibrator there are external disturbances the calibrator or the measurement channel the accelerometer or the instrument itself are damaged Note During the calibrat...

Page 27: ...er this operation the Calibration History window will not contain any previous calibration records The content of this window is also cleared after the Factory Settings operation 4 3 6 Post measurement calibration Post Calibration Sometimes it is required to perform so called post calibration of the instrument Position Post Calibration enables the user to perform additional calibration after a mea...

Page 28: ...w indicates that the instrument is performing a measurement 5 1 Setting up the main measurement parameters General Settings Delay before the measurement start The Start Delay position defines the delay period from the moment the Start Stop push button is pressed to the start of the actual measurements the digital filters of the instrument constantly analyse the input signal even when the measureme...

Page 29: ...ter than one The definitions of the measurement results in which the integration period is used is given in App D To set the integration period the user should define the required hours minutes and seconds fields The appropriate field may be selected by pressing the or push buttons Value of hour minute and second is changing by means of the or push buttons Number of measurement repetitions The Rep...

Page 30: ... when the conditions set in the General Settings sub list are fulfilled or after pressing the Start Stop push button or after receiving the proper control code remotely Note When measurement is waiting for the slope trigger the trigger slope icon appears alternatively with the play icon or Level type trigger When Level or Level is selected for the measurement the triggering condition is checked ev...

Page 31: ...g signal refers to the instantaneous value of the RMS result from the first profile calculated during the period depending on selected Detector path Menu Measurement Profiles Speed of the triggering signal changes This position appears when the Grad trigger is chosen The speed of change of the triggering signal Gradient can be set within the range from 1 dB ms to 100 dB ms 5 3 Setting up the param...

Page 32: ...e in fact it can be possible to save to sequences of measured results one for summary results and another for logger results When the Logger is switched on up to 12 logger results can be saved simultaneously from three independent profiles of the instrument Peak P P Max RMS with time step down to 2ms The recording of logger results to the file is stopped after the period which is equal to Integrat...

Page 33: ...ality which enables the user to save selected results from the three profiles and spectra with the defined interval selected in the Logger Step position The Summary Results position allows the user to select or deselect the saving of the full set of profile results that the instrument generates during total measurement time and which are not belonged to the time history data These results are RMS ...

Page 34: ...ieved the logger file is closed and new file with the increased by one number is opened for subsequent measurement data If Spec Time is selected 6 additional lines appear in the end of the Logger Setup list Opening each line the user can define the time of the day when the split will take place The special screen with time edition is opened after pressing the push button In the time edition line t...

Page 35: ...Level type trigger If the triggering signal is greater than the selected in Level or less than Level the logger contains the measurement results recorded directly before the fulfilment of the triggering condition time of the recording can be calculated by multiplying the value set in the Pre position by the time period taken from the Logger Step path Menu Measurement Logging Logger Setup all measu...

Page 36: ... Logger Setup The result of the calculation is presented in the same line at the right side of the display 5 4 5 Setting up the event recording Event Recording The Event Recording position enables the user to activate and set the parameters of event waveform signal recording in the logger file The Events position if it is not Off defines the type of events recording Continuous or On Trigger ENT No...

Page 37: ...he measurement starts and ended after the Integration Period time defined in the General Settings window path Menu Measurement General Settings The Source position indicates the triggering signal source Only one measured result can be used as a source of the triggering signal in all modes namely the output signal from the RMS detector coming from the first profile which is denoted here as RMS 1 Th...

Page 38: ...k of logger results in which the event occurred In case of point markers there is no start and end of the marker but only one record in the logger file Markers are activated in the result presentation window by pressing the arrow keys The Marker Setup enables the user to assign a specific name for each marker select its type normal or Point and define markers for event recording ENT Name edition i...

Page 39: ...ne The Format parameter enables the user to select the format of the wave file header PCM or Extensible The Audio Sampling position enables the user to select the sampling frequency of the wave recording 12 kHz 24 kHz and 48 kHz The Bits Per Sample position enables the user to select the number of recorded bits per sample 16 or 24 The Signal Gain position enables the user to select the gain of the...

Page 40: ...ssed not only in decibels but also in linear units The vibration unit scale can be set in the Display Scale window path Menu Display Display Scale Scale In the Trigger Period position it is possible to select the time interval of checking the triggering conditions This parameter can be set at Log Step same as Logger Step value 0 5ms 100 0ms and 1s In the Recording Time position it is possible to s...

Page 41: ...onnected the RPM probe to the Probe input socket The RPM Measurement position enables the user to programme the measurements of rotational speed measured by tacho probe The RPM function usually is an optional function and should be activated during first attempt to switch it on ENT Note The RPM function is optional and should be unlocked by entering the activation code in the text editor screen op...

Page 42: ...d minute can be selected in a special window which is opened by means of the or push buttons To set hours or minutes the user should enter the left or right field by pressing the or push button and then select the proper value by means of the or push buttons and finally to press ENTER Day of the measurement start The Start Day position determines the date for the measurement to start The timer can...

Page 43: ... 00 measure the sound for 1 minute and save the results in a file named L4239 To do this the user should set the parameters of the Timer function the measurement parameters path Menu Measurement General Settings name the file path Menu Measurement Logger Logger Setup and finally switch off the instrument The instrument will be switched on the 2nd of January at 00 00 and will be warmed up for the p...

Page 44: ...e display Acceleration Velocity and Displacement This position appears only in spectrum analyser functions Screen Setup enables the user to set up the brightness and the switch on off the energy saver function 6 1 Selection of the view modes Display Modes The One Result view is always available in all measurement modes Other view modes can be switched on or off in the Display Modes sub list The mo...

Page 45: ...r push buttons Changing the view mode The view mode is changed after pressing the or push buttons together with Alt Combined views There are three display modes that combine two views and can be activated or not 1 Prof 3 Prof 1 Prof Logger 3 Prof Logger These combined views allow the user to compare results for profiles and to follow the history of measured results saved in the logger file Fields ...

Page 46: ...Ovl results Fields description of the 3 Profiles view 1 File name 2 Result line for Profile 1 3 Result line for Profile 2 4 Result line for Profile 3 5 Function name RMS Ovl Peak P P MTVV 6 The value of the measured function 7 Units of the measured value Fields description of the Logger view 1 Logger Plot 2 Function name Profile number 3 Function value for cursor position 4 Cursor time position Ch...

Page 47: ...h the Logger on When Logger is On and some results have been selected for logging the logger plot can be viewed Fields description of the Logger view 1 Y scale 2 Logger plot 3 Name of the logged result and profile number 4 Name of the file 5 Real Time Clock 6 Cursor position 7 Result value for the cursor position 8 Cursor time position The user can change the cursor position by means of the or pus...

Page 48: ... result is related to the values set in the Reference Levels window path Menu Auxiliary Setup Reference Levels Note The parameters can be presented in Logarithmic dB or Linear for example m s2 units It depends on the Scale parameter value For example 10 m s2 can be presented as 140 dB The Resolution position defines the number of digits after the decimal point in the presented results one digit af...

Page 49: ...s curve ENT The view of the logger screen can be adjusted quickly without stopping the measurement Highlight the function field in the bottom left hand corner then press the ENTER push button and the Logger View list will be displayed The user can make necessary adjustments and return to the Logger view after confirmation of the performed changes by means of the ENTER push button ENT 6 4 Setting u...

Page 50: ...sing any push button defined by the parameters Dim screen delay or Screen off delay the screen is dimmed or switched off If it has happened the first press of any push button will cause the screen to switch back on again Power saver delay The power saver delay defines the delay period from last use of any push button to the power saver mode This delay period can be set for Dim screen on idle from ...

Page 51: ... active only when an SD Card is inserted into the card slot under the bottom cover of the instrument If there is no SD card after user s attempt to enter any position in the File list the instrument will generate warning There are three types of files that the instrument generates Logger files with measured data extension SVL WAV files with time waveform recordings extension WAV Setup files with m...

Page 52: ...nager list is New Directory which enables the user to create the new directory To do this the user should enter the directory in which the new one will be created and press the ENTER push button at the New Directory position ENT The marked directory can be opened by means of the push button To return to the upper directory the user should press the push button 7 1 1 Assigning the directory for fil...

Page 53: ...he file name To see next cycle data the user should select the record counter position by means of or push button and then change the record number by means of the or push button pressed together with Alt Alt 7 1 3 Deleting file directory Delete The user can to delete a file or directory from the file directory list To do this the user should select the file directory and press the ENTER push butt...

Page 54: ...erated and rename command will not be performed After pressing any key the instrument will return to the editor window ENT 7 1 6 Viewing information about files Info The user can view information about file To do this the user should select the desired file and press the ENTER push button In the command list select the Info command and press ENTER The information window will be opened ENT The file...

Page 55: ...etup files To load settings saved in the setup directory the user should press ENTER on the selected file Then the user should confirm the loading in the opened window by pressing the ENTER push button After loading the setup file the instrument will be reconfigured ENT Deleting the setup files Deleting the setup files is performing in the same way as deleting of files from the File Manager list R...

Page 56: ...rmation about the type of the instrument its serial number the current software versions installed and the standards the instrument fulfils 8 1 Measurement auto start Auto Start The Auto Start position enables the user to start the measurement just after the switching the instrument on without pressing the Start push button ENT 8 2 Checking the instrument powering Battery The Battery position enab...

Page 57: ...he desired result the second push button should be pressed at the same time with Shift Alt When the 2nd Fun option is selected the Shift Alt push buttons operate in sequence with the other one This enables the user to use only one hand to operate the instrument Start Stop push button working mode selection In the Start Stop position the user can choose between Direct and With Shift When the Direct...

Page 58: ...rameter Function It is possible to set up Slope as positive or negative by means of the or push buttons Digital output function of the I O socket The Function position enables the user to set the function of the digital output of the I O instrument s socket The socket can be used as the source of the trigger pulse Trigger Pulse which starts the measurement in another slave instrument linked to the...

Page 59: ... 60 0 dB 180 dB 8 6 Setting up the instrument s internal Real Time Clock RTC The RTC position enables the user to programme the internal Real Time Clock This clock is displayed in the different places of the display depending on the selected view mode ENT The required Time hour minute and second can be selected in a special window which is opened by means of the or push buttons To set hours minute...

Page 60: ...mber the current software version installed and the relevant standards which the instrument fulfils The displayed text is scrolled on the display after pressing and ENT Note The contents of the Unit Label window should be always sent to Svantek service department or official representative in case of any problems faced by the user during the instrument s normal operation in the field ...

Page 61: ...e measurements are to be viewed Warnings enables the user to switch the warnings on or off that can be displayed during the normal operation of the instrument 9 1 Selecting the language of the user interface Language The Language sub list enables the user to select the language of the user interface If after turn on the instrument an unknown language interface appears on the display the user can r...

Page 62: ...ts Vibration Units The Vibration Units sub list enables the user to select the units for the Vibration measurements It is possible to select the Non Metric units e g g ips mil etc or Metric units e g m s2 m s m etc ENT 9 5 Warnings setup Warnings The Warnings sub list enables the user to activate the messages which will be displayed during the normal operation of the instrument ENT Saving the meas...

Page 63: ...lected limit should be within the range 1 MB 1024 MB Confirmation of parameters changes If the Save Changes position is On the instrument displays the warning message in case some parameters were changed but the window with parameter list was exit by means of the ESC push button Confirmation of the instrument turn off If the Power Off position is On the instrument displays the warning message in c...

Page 64: ...pectra are presented for all centre frequencies of pass band filters together with the Total overall values measured with preselected frequency weighting filters The read out of the spectrum value can be done using a vertical cursor 10 1 Selection of 1 1 Octave or 1 3 Octave functions To select the 1 1 Octave or 1 3 Octave analysis function the user should enter the Function list by pressing the M...

Page 65: ... filters are set by default and can not be changed The output of the selected octave or third octave band result can also be used to trigger an alarm saving logger results recording time history signal and the event 10 2 1 Checking the measurement range for 1 1 Octave and 1 3 Octave Range For the 1 1 Octave or 1 3 Octave functions there is only one Single input range specified in Appendix C The us...

Page 66: ...g Logger Setup The spectrum saving in the logger file is defined by activation the Spectrum position in the Logger Results window by means of the or push buttons Note The spectra are always saved together with the summary results with integration period step 10 4 Setting up the 1 1 Octave and 1 3 Octave spectra view The Display list is used for setting the various parameters which are mainly dedic...

Page 67: ...can shift the Y axis during the spectrum view after pressing the Shift and or Shift and push buttons Sh The user can change the cursor position by means of the or push buttons The user can change quickly to the first or last spectrum line by simultaneously pressing the or buttons with Shift The band central frequency and the appropriate value are presented in the line below the plot 10 4 2 Setting...

Page 68: ...pectrum are made for the dynamics of the axis 40 and 80 dB Switching the grid on off The Grid enables the user to switch on or off the horizontal grid lines in the spectrum view 10 4 3 Selection of the spectra to be viewed Spectrum View In the Spectrum View window the user can select the different spectra to be visible on the display In the Spectrum View window the following spectrum types may be ...

Page 69: ...he or push buttons pressed together with Alt Alt The user can easily get into the Spectrum View screen from the spectrum view It is necessary to enter the result field RMS with the use of or push buttons and press ENTER ENT 10 4 4 Selection of the spectrum type Spectrum Type In the Spectrum Type window the user can select the different types of vibration spectra to be presented on the display Acce...

Page 70: ...sition and press ENTER ENT Note It is not possible to change the current function during a measurement In this case the instrument displays for about 2 seconds the text Measurement in Progress To change the current function the measurement must be stopped 11 2 Configururing FFT analyser Execution of the FFT analysis depends on a certain number of parameters which can be set in the different window...

Page 71: ...indow Window number of lines Lines averaging type Averaging and detection od Peak Peak detection ENT In the Band position the user can select the band in which the FFT analysis should be performed The user can select 20 kHz 10 kHz 5 kHz 2 5 kHz 1 25 kHz 625 Hz 312 Hz 156 Hz and 78 Hz Only one HP weighting filter is available for the FFT analysis of vibration The characteristics of the filters are ...

Page 72: ... all the peaks found in the form of a table The first column indicates the frequency of the peak and the second its value 11 3 Saving the FFT spectra as a time history Logger Results The FFT analysis results can be saved in the logger file together with the logger results and with the step defined by the Logger Step parameter path Menu Measurement Logging Logger Setup The spectrum saving in the lo...

Page 73: ...e user to switch on or off the spectrum view ENT Fields description of the Spectrum view 1 Type of spectrum 2 Cursor position 3 Value for the cursor position 4 Averaging used 5 Spectrum plot 6 Frequency weighting filter used 7 Total value 8 Central frequency for the cursor position The user can shift the Y axis during the spectrum presentation after pressing the Shift and or the Shift and push but...

Page 74: ...hical presentation is given in the logarithmic scale and the measurement results are expressed in decibels the result is related to the values set in the Reference Levels window path Menu Auxiliary Setup Reference Levels Scaling the plot vertical axis The Dynamic position enables the user to select the required dynamic range scaling of the spectrum plot It is possible to select the range from the ...

Page 75: ...rum View screen from the spectrum view It is necessary to enter the result field RMS with the use of or push buttons and press ENTER ENT To enable the cursor to read the Max or Min values the user should select the field in the lower left hand corner of the display by means of the or push buttons Then select the appropriate value by means of the or push buttons pressed together with Alt Alt 11 4 4...

Page 76: ... charger SA 31 To change or charge the batteries the user should switch off the instrument unscrew the bolt take off the black bottom cover of the instrument and slide the battery tubes out Note While changing the batteries observe the correct polarity Powering the instrument from the USB interface is performed by connecting its USB socket to the PC or other USB power source via the SC 56 cable Wh...

Page 77: ...gged environments of industrial machinery monitoring such as pumps motors or fans The accelerometer is mounted on a vibrating surface with the mounting magnet The design of SV 80 features the low electronic noise and wide temperature operating range The connection of the accelerometer to the instrument is performed with the use of TNC connector TNC connector has a ring which should be tighten to t...

Page 78: ... Do not store the instrument permanently connected to the USB port It shortens battery lifecycle When the instrument is turned off it still draws a small amount of battery power Therefore it is recommended to charge the cell every few months if it is not going to be used regularly 12 7 Transportation and carrying For transportation or storage purpose we recommend using the packaging provided by th...

Page 79: ...ervice Office 48 22 51 88 320 or 48 22 51 88 322 Office hours are 8 00 a m to 4 00 p m Central European Time E mail at office svantek com Internet at www svantek com Address SVANTEK Sp z o o Strzygłowska 81 04 872 Warszawa Poland ...

Reviews: