


Single Gas Analyzer (SGA)
Operations Manual
Super Systems Inc.
Page 11 of 44
Page 11 of 51
The function buttons run along the bottom of the screen.
The folder button -
- stores saved templates. A different chart template can be selected here.
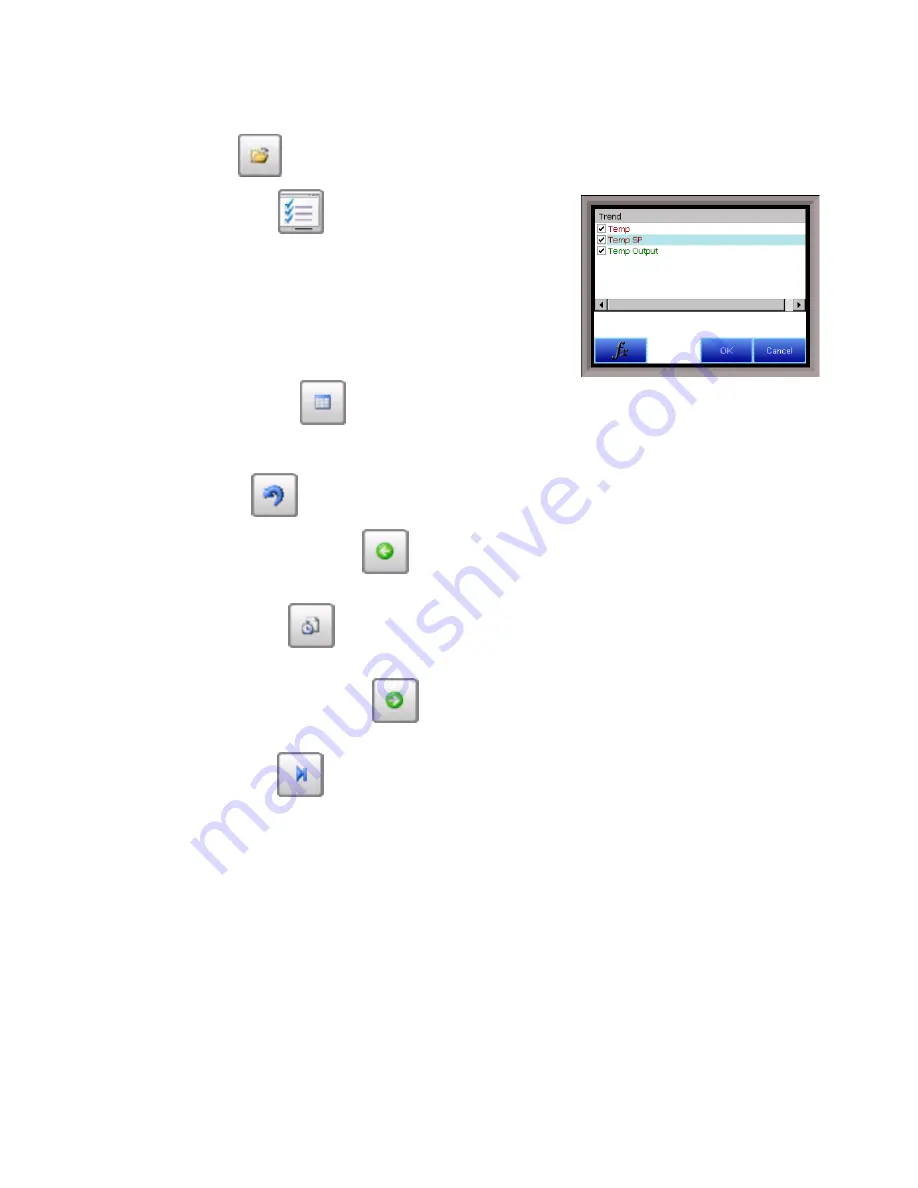
The Trend Lines button -
- will allow the user to select or de-
select the trend lines on the trend chart to display. If the checkbox
next to each trend line is checked, then that trend line will be
displayed.
The Datagrid View button -
- will display a screen with the
trend data in a grid format instead of with trend lines. The trend data is shown in 1-minute intervals.
Clicking on the OK button on this screen will close the screen down and return to the Chart Display screen.
The Refresh button -
- will refresh the screen’s trend data if the screen is not in real-time mode.
The left-pointing green arrow button -
- will move the chart’s view backward in time by the specified
chart interval.
The chart interval button -
- will determine the number of hours displayed on the trend chart. The
options are: 1 Hour, 2 Hours, 4 Hours, 8 Hours, 12 Hours, or 24 Hours.
The right-pointing green arrow button -
- will move the chart’s view forward in time by the specified
chart interval.
The Play/Pause button -
- will put the chart into real-time mode if it is not in real-time mode, or
take the chart out of real-time mode if it is. When in real-time mode, the chart will automatically be updated
once a minute.


