


-112-
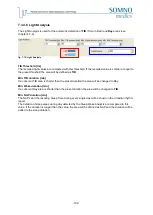
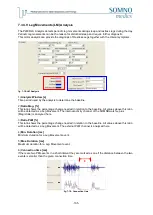
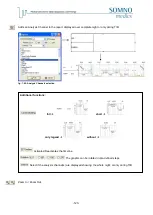
7.3.5
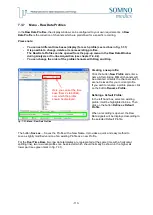
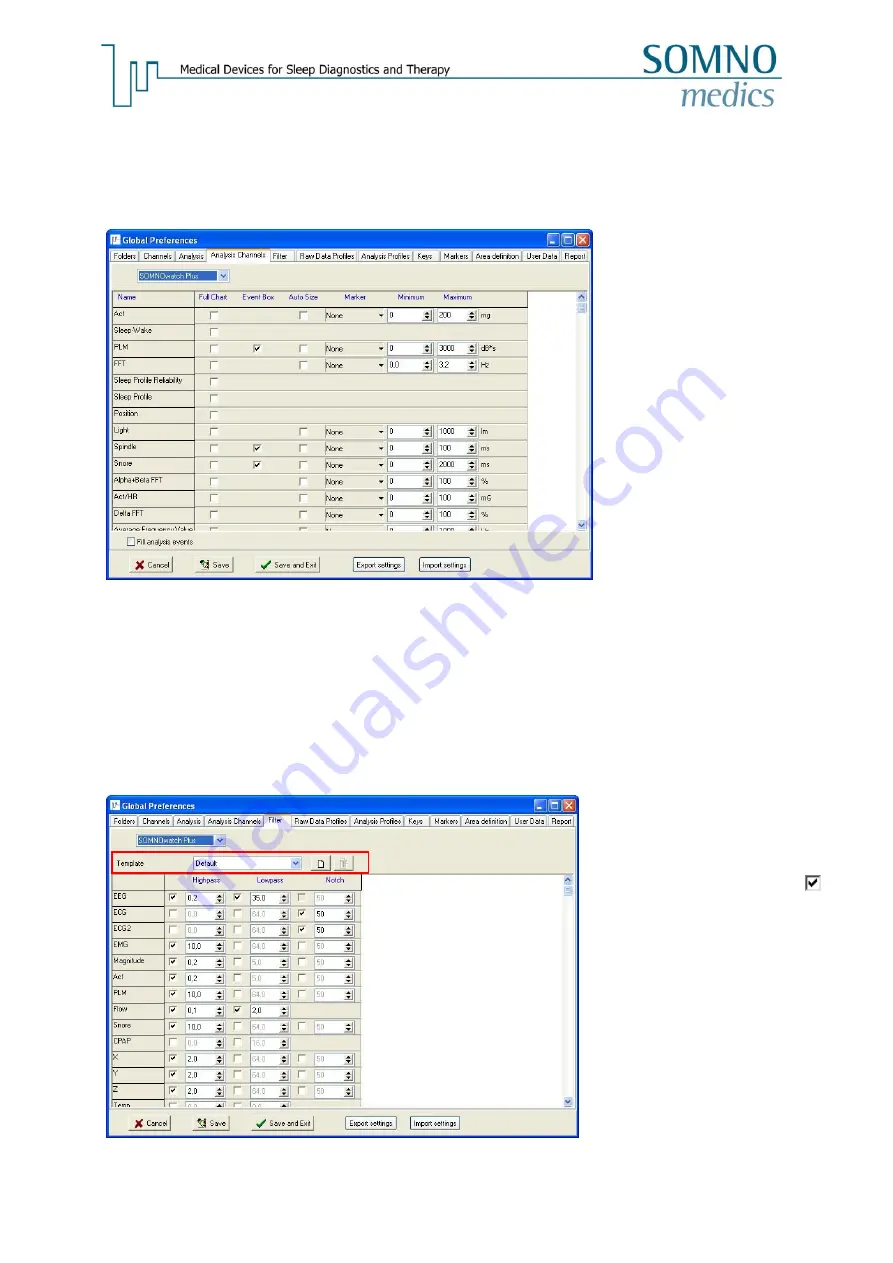
Menu - Analysis Channels
Within the Menu
Analysis Channels
the presentation of the analysis window can be formatted.
The Channel Order can be changed by using the Drag & Drop function.
fig. 7-29: Menu - Analysis Channels
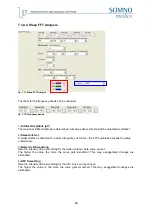
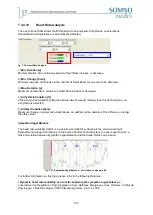
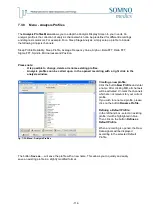
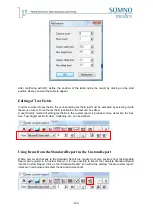
7.3.6
Menu
– Filter
fig. 7-30: Menu Filter
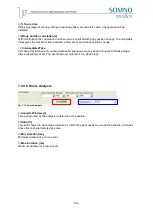
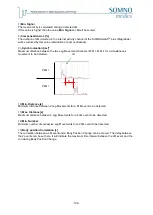
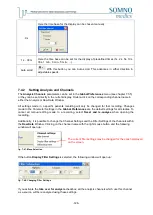
1
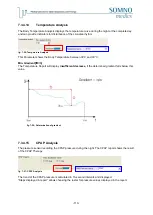
Full Chart:
Upon activating this option the
respective curve will be displayed
in full chart mode.
Event Box:
Upon activating this option
coloured frames will mark the
events of the respective signals in
the Raw Data window.
Auto Size:
This option will scale the amplitude
of the curve automatically.
Marker:
It is possible to set reference lines
that will be displayed in the
Analysis Channels.
Minimum/Maximum:
Enter minimum/maximum values to
scale the respective signal.
Fill analysis events:
Event Boxes will be displayed
slightly shaded in colour.
Mark the respective checkboxes
to
filter a specific signal. Settings (in Hz)
for
Highpass
,
Lowpass
and
Notch
can be individually selected.
The filter settings can be saved as a
template (
1
).
Summary of Contents for SOMNOwatch plus
Page 24: ...24 Body Temperature fig 6 8 Montage Temperature EDA fig 6 9 Montage EDA...
Page 25: ...25 Sleep Profile fig 6 10 Montage Sleep Profile ECG Analysis fig 6 11 Montage ECG...
Page 26: ...26 Training Rehab fig 6 12 Montage Training Rehab Flow Snore fig 6 13 Montage Flow Snore...
Page 42: ...42 Body Temperature fig 6 22 Analysis Template Temperature EDA fig 6 23 Analysis Template EDA...
Page 43: ...43 Sleep Profile fig 6 24 Analysis Template Sleep Profile...
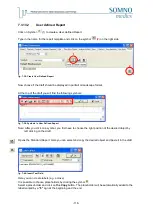
Page 63: ...63 Choose the item Activity profil within the Select Report window...
Page 72: ...72 recording on both legs...
Page 162: ...162 10 9 Notes...