


41
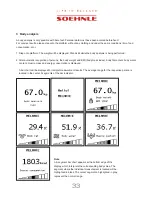
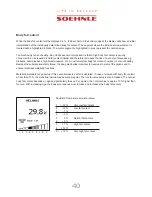
Body water content
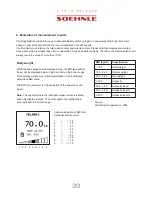
While the body water content will be displayed in %, the bar chart on the bottom edge of the display will show
an initial interpretation of the individually determined body water content. The segment where the individual
measurement is located will be highlighted in black. The center segments, highlighted in gray, represent the normal
range.
The value determined during this analysis corresponds to the so-called ”Total Body Water” (TBW).
The body of an adult contains approx. 60% water. There is a certain range in which older persons may have lower
water content than younger people and men show higher water content than women.
The difference between men and women is in this case based on the higher body fat content of women. Since the
majority of body water is located in non-fatty tissue (73%) and the water content of fatty tissue is naturally rather
low (approx. 10%), the body water content will automatically decrease as the body fat content increases.
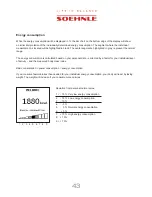
1 2 3 4 5 6 7 8 9
Deviation from personal normal value
1 < - 6 % Very low water content
2 - 6 % Low water content
3 - 4 %
4 - 2 %
5
0 % Normal water content
6 + 2 %
7 + 4 % High water content
8 + 6%
9 > + 6 %