Scanner
Data (Viewing PIDs)
58
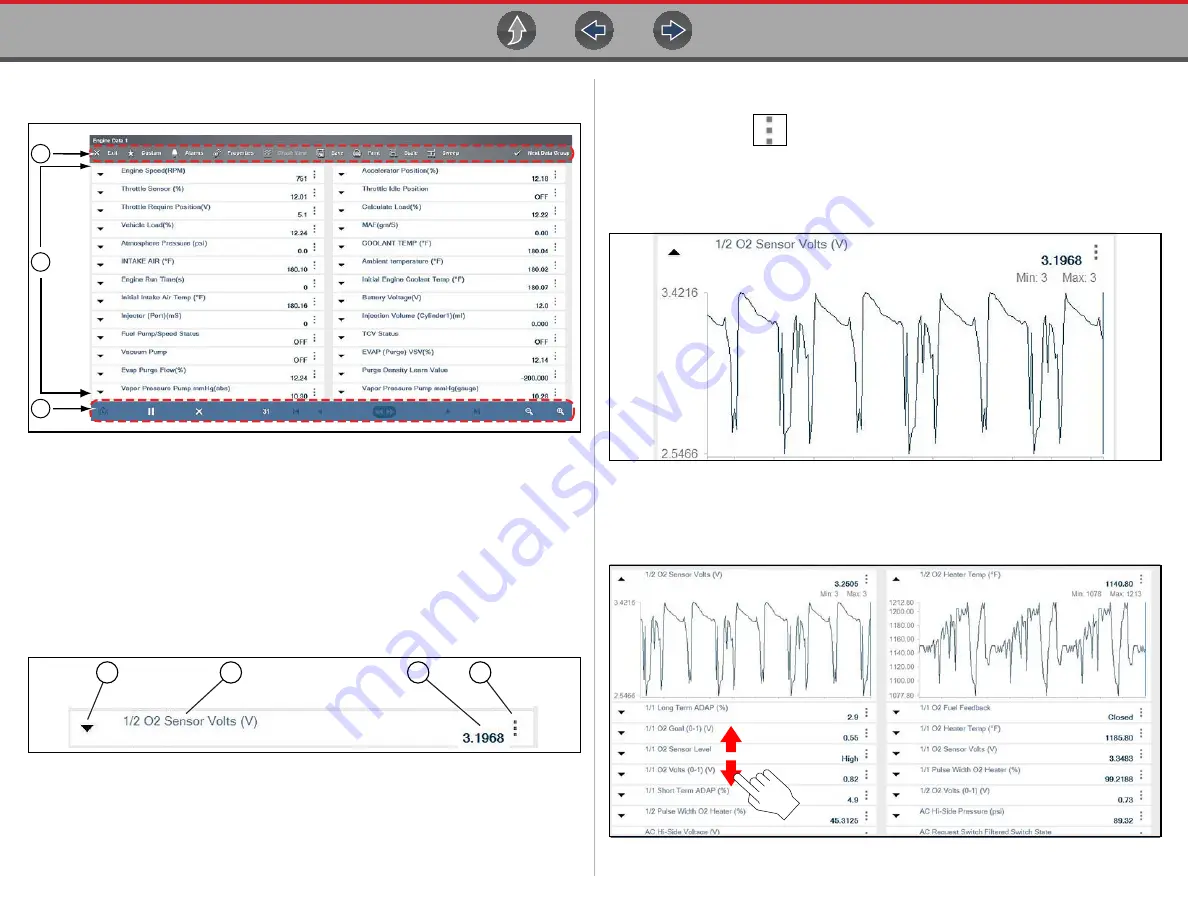
5.6.1 Data Screen Overview
1— Data Toolbar - see
2— Main Body
3— Data Controls Toolbar - see
Figure 5-32
Typical data screen (List / text) layout shown
Select the
Expand/Collapse
icon (
) to toggle a PID between list
) and graph display (
).
Selecting the
Expand/Collapse
icon (PID in list display), opens the PID in graph
display, and moves that PID to the top of the list (
).
1— Expand/Collapse Icon
2— PID Name/Description -
Descriptive name of the parameter ID
3— PID Current Value -
The PID Current Value can display as a value or as a status.
When displayed as a value, the value correlates with trace cursor line, which
indicates the current vertical point of the signal. When displayed as a status, it
correlates to an operational state (e.g. On/Off, Enabled/Disabled, etc)
4— Menu Icon -
Menu options for display and setup
-
Full Screen View
- expands the graph to fill the entire screen
-
Setup
- opens graph scale and trigger settings
Figure 5-33
Typical PID (list view)
Figure 5-34
Typical PID (graph view)
Use gesture scrolling (up/down) to quickly move through each data list
(
Figure 5-35
1
2
3
1
2
3
4


