101
Scope and Multimeter Operations
Navigation
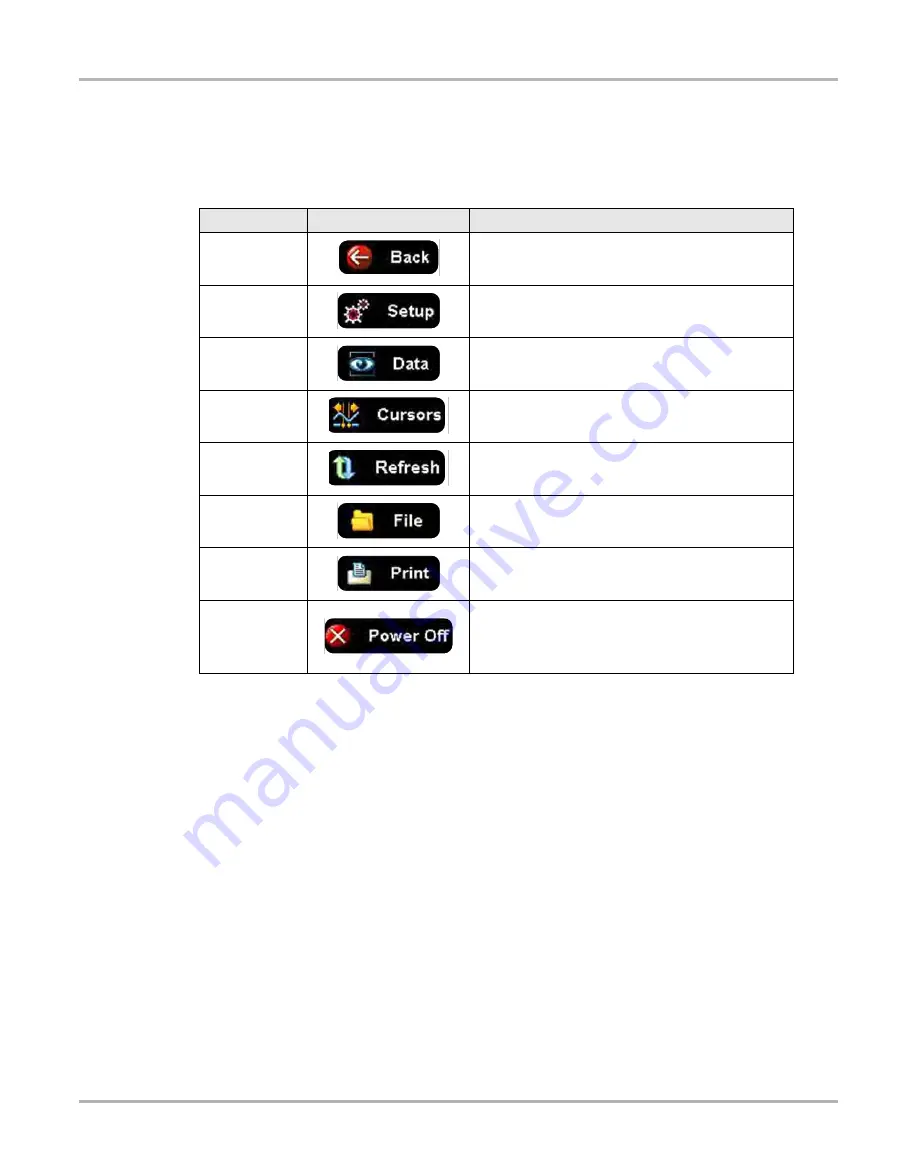
Scope Multimeter Toolbar
The Scope Multimeter toolbar is used to set up the tool for testing and to configure the settings for
each trace.
on page 101 gives brief descriptions of the control icons on the toolbar:
Main Body of the Screen
The main body of the screen varies depending on what display options have been selected. Up to
four traces, along with digital readouts of current signal values, signal status and triggering
conditions, can be displayed simultaneously on the main body of the screen. Adjustments to the
display are made through the scope toolbar as explained above.
Each trace is displayed as voltage over time on a standard oscilloscope screen. Voltage level is
recorded on the vertical, or “y”, axis and time is presented on the horizontal, or “x”, axis of the
screen. Values are shown for each graduation on the scales.
When using transducers, the pressure being sensed by the transducer is converted into a voltage
signal. However, the values are shown as pressure on the display screen rather than voltage.
Table 8-4
Scope Multimeter toolbar icons
Name
Icon
Description
Back
Returns to the previously viewed screen.
Setup
Opens a dialog box that allows you to select
personal preferences for viewing and saving data.
Data
Switches the trace information displayed at the base
of the screen between three available states.
Cursors
Opens a dialog box that allows you to switch cursors
on and off, and to reposition them on the screen.
Refresh
Clears the Min/Max and Current values on the trace
details section of the screen.
File
Opens a dialog box that allows you to select options
for saving data.
Opens a dialog box that allows you to configure and
print data.
Power Off
Switches the Scope Multimeter off. This retains the
settings and reduces battery drain when switching to
a different module. The Play and Record icons on the
Playback toolbar switch the meter back on.


