background image

100

Scope Multimeter

Optional Settings

z

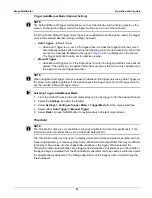
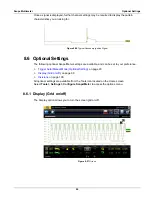
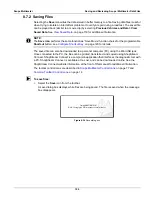
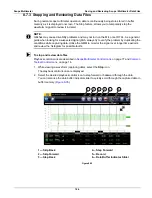
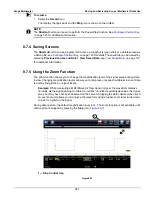
Changing the Display (grid on/off):

1. Select the 

Tools

 icon from the Home screen.

2. Select 

Settings > Configure Scope/Meter > Display

 from the menu options.

3. Select the desired option:

Show Grid

—turns grid lines on

Hide Grid

—turns grid lines off

4. Select the 

Back

 icon or press the 

N/X

 button to return to the Settings menu.

8.6.2  Divisions

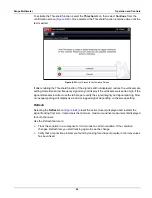
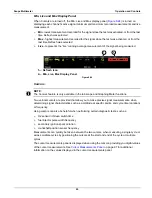
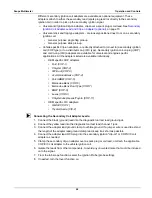
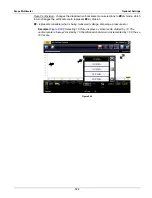
The Divisions options allow you to change (to your preference) how the Vertical Scale Menu 
selections are represented, and the type of value that displays in the Vertical Scale icon. 

This section describes the following settings:

Trace

Trace Full Scale

Trace Per Division

Display

Display Full Scale

Display Per Division

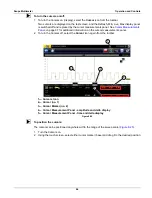
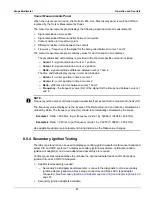
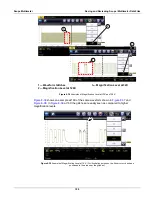
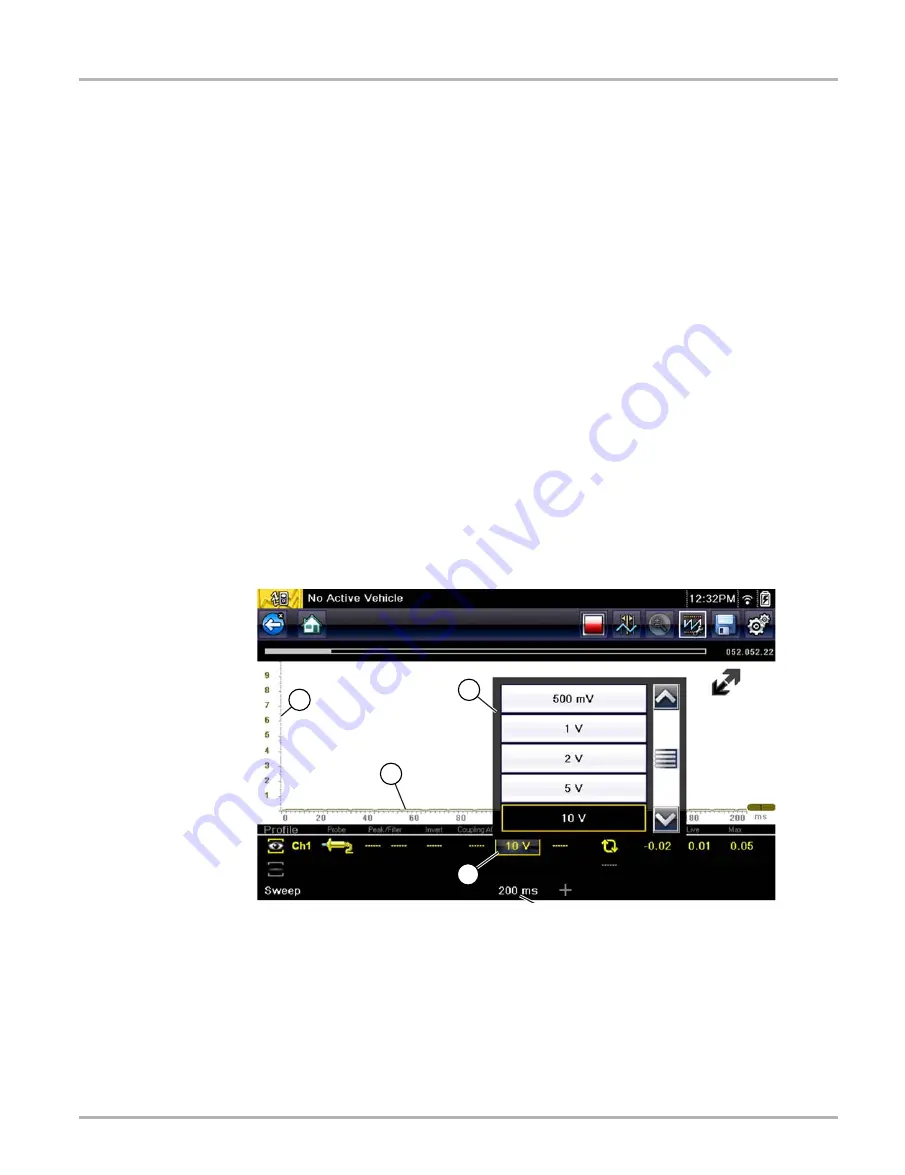
The following illustration is for reference, and identifies key terms and features used in this 
manual.

1— Vertical Scale
2— Sweep (horizontal or time) Scale


3— Vertical Scale Menu
4— Vertical Scale Icon


Figure 8-28 

1

2

4

3

Summary of Contents for Modis Ultra

Page 1: ...User Manual EAZ0079L23C Rev B 1 H 18 UK ...

Page 2: ...p on reserves the right to make changes at any time without notice IMPORTANT Before operating or maintaining this unit please read this manual carefully paying extra attention to the safety warnings and precautions Software License Information Use of Software is governed by the terms and conditions of the End User License Agreement The diagnostic tool should not be initially operated until the End...

Page 3: ... specific training videos are available on our website Follow along and learn the basics of diagnostic tool operation with our free training videos Videos are product specific and are available at http diagnostics snapon co uk Click on the Training and Support tab select Diagnostic Tools then select the applicable diagnostic tool and then select See Quick Tips NOTE i Sample titles are listed below...

Page 4: ... select See Quick Tips https www youtube com user snaponscanner videos Use the search function to find a title or enter Diagnostic Quick Tips in the search field to see a list of all applicable titles NOTE i URL links above and titles listed below are subject to change and may not be available in all markets A sample list of titles are listed below other titles may be available Some videos may not...

Page 5: ...es Ford Battery Monitor System Oil Specs Service Light Resets Ford Coil Current RFI Test Scope PID Trigger Functions Scanner Ford Flash Reprogramming Piezo Injectors Signature Test Ford Misfire Monitor Neutral Profile Correction Scanner Relative Compression Test Scope Ford PATS Key Programming ShopStream Connect Data Manipulation Ford Relative Compression Test ShopStream Connect Software Updates F...

Page 6: ... 9 Power Key 9 Power Sources 9 Internal Battery 9 AC Power Supply 9 Vehicle Power 10 The Stand 10 Chapter 3 Getting Started 11 Powering Up 11 Home Screen 11 Title Bar 11 Home Screen Buttons 13 Common Toolbar Control Icons 14 The Demonstration Program 15 Powering Down 15 Emergency Shutdown 15 Chapter 4 Navigation 16 Screen Messages 16 Loading and Connecting Messages 16 Confirmation Messages 16 Warn...

Page 7: ...BD 54 Start Communication 54 Select Communication Protocol 58 Connector Information 59 Chapter 7 Guided Component Tests 60 Vehicle Identification 60 Identifying a Test Vehicle 60 Training and Classes 61 Power User Tests 62 How To Guide 62 Features and Benefits 62 Index 62 Operations 63 Component Information 63 Tests 64 Chapter 8 Scope Multimeter 67 Overview 67 Digital Multimeter DMM 67 Graphing Mu...

Page 8: ...06 Saving Screens 107 Using the Zoom Function 107 General Reference 110 Basic Setup Tips unknown signal type 110 Using Known Good Waveforms 111 Troubleshooting Signals 112 Units of Measurement Conversions 113 Glossary of Common Terms 115 Chapter 9 Previous Vehicles and Data 118 Vehicle History 118 View Saved Data 119 Viewing Codes and Code Scan Results 120 Delete Saved Data 121 Chapter 10 Tools 12...

Page 9: ...g to a hidden network 140 Wi Fi Testing 140 Wi Fi Troubleshooting and Status Messages 142 Informative Messages 144 Chapter 13 ShopStream Connect 145 Using SSC Connecting to your PC 145 SSC Main Screen 146 Scanner DataViewer 147 Image Viewer 148 Printing the Code Scan Report 149 Software Upgrades and Updates 151 End User License Agreement 152 ...

Page 10: ...we cannot possibly anticipate or provide advice or safety messages to cover every situation It is the responsibility of the automotive technician to be knowledgeable of the system being tested It is essential to use proper service methods and test procedures It is important to perform tests in an appropriate and acceptable manner that does not endanger your safety the safety of others in the work ...

Page 11: ...anders 87 21 Indicates a potentially hazardous situation which if not avoided may result in moderate or minor injury to the operator or to bystanders Safety messages contain three different type styles Normal type states the hazard Bold type states how to avoid the hazard Italic type states the possible consequences of not avoiding the hazard An icon when present gives a graphical description of t...

Page 12: ... 1 2 Symbols Different types of arrows are used The greater than arrow indicates an abbreviated set of selection instructions Example Select Tools Connect to PC The example statement abbreviates the following procedure 1 Select Tools from the home screen 2 Highlight Connect to PC on the Tools menu 3 Select Connect to PC The solid arrows e c d b are navigational instructions referring to the four d...

Page 13: ... damage to the test equipment or vehicle Example IMPORTANT Do not disconnect the data cable while the Scanner is communicating with the ECM 1 1 5 Hyperlinks Hyperlinks or hot links that take you to other related articles procedures and illustrations are available in electronic documents Blue colored text indicates a selectable hyperlink Example IMPORTANT Read all applicable Safety Information befo...

Page 14: ...ibes the construction of the diagnostic tool and addresses the use of the basic hardware controls and features in the following sections Functional Description Technical Specifications on page 7 Control Keys on page 8 Power Sources on page 9 The Stand on page 10 2 1 Functional Description 1 N X key No Cancel or Return 2 Y a key Yes Accept or Continue 3 Directional key left e right c up b down d 4 ...

Page 15: ... Power Supply Input Port 3 Scope Multimeter Jacks 4 Mini USB Client Port 5 Micro secure digital microSD Card Port 6 Data Cable Port Figure 2 2 Top view 1 Collapsible Stand closed 2 Battery Compartment Cover Figure 2 3 Back view 9 6 1 5 7 1 9 0 61 3 21 1 25325 7 5 76 5 6 59 127 9 7 287 6 5 180 5 ...

Page 16: ...DC Dimensions Width 12 9 inches 327 2 mm Height 6 5 inches 165 mm Depth 2 04 inches 51 8 mm Weight including battery 3 25 lbs 1 47 kg Operating Temperature Range ambient At 0 to 90 relative humidity non condensing 32 to 113 F 0 to 45 C Storage Temperature ambient At 0 to 70 relative humidity non condensing 4 to 140 F 20 to 60 C Meter Category I Environmental Conditions This product is intended for...

Page 17: ...3 Cancel N X Key The N X key is used to do the following To exit a menu or program To close an open list and return to the previous menu To answer No when a yes or no choice is given Key Icon Description Accept Yes Selects a menu or program advances to the next screen or provides a yes answer to a question on the screen Directional Arrows Moves the highlight on the display screen up down left and ...

Page 18: ...d from the internal rechargeable battery A fully charged standard battery provides sufficient power for about 3 hours of continuous operation An LED on top of the unit Figure 2 2 illuminates to indicate DC power is being supplied to the tool The internal battery is recharged whenever an outside power source is provided Either connecting the Data Cable to a powered data link connector DLC on a vehi...

Page 19: ...agram to troubleshoot any circuit problems on the vehicle Certain vehicles do not provide vehicle power on the DLC For these applications a separate cable adapter and power cable are needed to power the unit Optional data cable adapters are available for a number of vehicle manufacturers Contact your sales representative for availability The power cable connects to a port on the cable adapter IMPO...

Page 20: ...ol on 3 2 Home Screen The main body of the Home screen has six selectable buttons one for each of the primary diagnostic tool functions These are explained briefly in the next section and discussed in detail in the Navigation chapter 1 Titlebar 2 Main Body Figure 3 1 Sample Home screen 3 2 1 Title Bar The title bar at the top of the screen provides basic information about current tool operating co...

Page 21: ...ower supply icon whenever the diagnostic tool is actively communicating with a vehicle or is connected to Wi Fi The Title bar displays other information that varies depending upon what functions are being performed Other data may include The identification ID of the test vehicle The name of the active menu or module The name of the test being performed Table 3 1 Power supply icons Icon Definition ...

Page 22: ...cally clear once the module is loaded and ready for use Table 3 3 Home screen buttons Name Button Description Scanner Opens a list of vehicle manufacturers to begin the process of establishing a communications link to a test vehicle See Scanner on page 23 for details OBD II EOBD Performs generic OBD II EOBD system tests without first identifying a test vehicle See OBD II EOBD on page 51 for detail...

Page 23: ...enu Save Writes data from buffer memory to a file The saved movie file can be accessed for future reference by selecting Previous Vehicles and Data View Saved Data The control icons below are used to navigate through paused or saved movie files during playback Step Forward allows forward movement in singular steps To quickly step forward select this icon yellow frame appears then press and hold th...

Page 24: ... from the Demo mode message screen A systems menu which shows all of the systems available for testing displays 7 Select from any of the systems listed then select from the submenus 3 4 Powering Down Use the Power key to turn the diagnostic tool off IMPORTANT All vehicle communication must be terminated before shutting down the diagnostic tool A warning message displays if you attempt to shut down...

Page 25: ...tion such as loading a database initiating a test or establishing communications with the vehicle The message automatically clears once the internal operation is complete 4 1 2 Confirmation Messages Confirmation messages inform you when you are about to perform an action that cannot be reversed or when an action that requires your confirmation to continue has been initiated When a response is not ...

Page 26: ...e toolbar located under the title bar contains a number of selectable tool control buttons What buttons appear on the toolbar varies as only buttons that are active or available for the current screen and test mode display Toolbar button operations are explained in Table 4 1 Table 4 1 Scanner toolbar buttons part 1 of 2 Button Icon Function Back Returns to the previously viewed screen This button ...

Page 27: ... parameter Locked parameters move to the top of the list and do not scroll as you move through the data Save Saves the current screen information along with the data stored in the buffer to tool memory Tools Opens the tools menu which allows you to adjust basic tool settings Previous Point Moves back one data point with each button push when viewing recorded or paused data Hold the button down to ...

Page 28: ...inning 2 Up 1 Page 3 Slider position indicator 4 Down 1 Page 5 End Figure 4 2 Sample scroll bar To navigate data in the main body Tap the Up 1 Page or Down 1 Page arrowhead buttons near the ends of the scroll bars to move through the data in the direction of the arrow one page at a time Select the Beginning arrowhead at the very top of the scroll bar to quickly move to the start of the data list U...

Page 29: ...rences are in the information that is being displayed on the screen and how the data is gathered Guided Component Test data is vehicle specific Therefore the meter that displays is configured to perform the selected test on the identified vehicle In addition to displaying test results procedures tips and specifications for the selected test are available at the touch of a button Scope Multimeter t...

Page 30: ...gh the data Next Point Moves forward one data point with each button push when viewing recorded or paused data Hold the button down to keep moving back through the data Stop Stops the collection of data which allows you to more closely examine the trace and to review the data that is being held in the memory buffer Record Indicates that data collection has been paused and the data being displayed ...

Page 31: ... level is recorded on the vertical or y axis and time is presented on the horizontal or x axis of the screen Values are shown for each graduation on the scales Touch screen functionality within the main body of the screen is limited most adjustments are performed from the Toolbar and the Profile window However you can adjust the following in the main body Trigger position touch and drag the trigge...

Page 32: ...ectly This vehicle identification sequence is menu driven simply follow the screen prompts to make a series of choices Each selection advances you to the next screen Exact procedures may vary by the make model and year of the test vehicle z To identify a vehicle for Scanner testing 1 Tap the Scanner button on the Home screen A list of manufactures displays Figure 5 1 Figure 5 1 Sample manufacturer...

Page 33: ... select a OK to continue b Cancel to return to the previous screen When the vehicle identification is confirmed a list of systems available for testing displays 5 Select a system from the list to continue Figure 5 3 Figure 5 3 Sample available systems list NOTE i Only the systems available for testing on the identified vehicle are included in the list The identification sequence is now complete ...

Page 34: ...I EOBD allows you to perform generic OBD II or EOBD tests See OBD II EOBD on page 51 for additional information Select by Database allows you to begin the vehicle identification by first selecting which database to load Selecting opens a menu of available databases 5 2 Connecting to a Vehicle Instructions for connecting the Scanner to the vehicle with the data cable are shown on the screen once a ...

Page 35: ...y power B available on the DLC The optional auxiliary power cable supplies power for testing non OBD II EOBD models that do not have B available on the diagnostic connector The optional cable and adapters are required for testing non OBD II EOBD models z To connect the data cable to the vehicle 1 Follow the on screen instructions for connecting to the vehicle Figure 5 4 2 Select Continue once the ...

Page 36: ...g tips and trouble code information are typically available The Scanner has two main functions 1 Scanner provides access to vehicle systems to perform functions such as reading codes viewing data and conducting functional tests 2 Troubleshooter provides the diagnostic power of Troubleshooter a database of experience based information developed by master technicians After a system is selected and t...

Page 37: ...tive values for certain components after making repairs Selecting opens a submenu These options are found on the Functional Tests Menu for some models System Tests provides specific subsystem testing Performing these tests is similar to functional tests Generic Functions lets you access certain available Generic OBD II functions from a proprietary menu 1996 and newer vehicles only Troubleshooter p...

Page 38: ...ons The code list includes the DTC and a brief description Figure 5 6 If SureTrack optional is active and data is available for a selected DTC additional troubleshooting information from SureTrack e g Common Replaced Parts data Figure 5 6 Real Fix and Related Fixes will also be available For additional information about using SureTrack see SureTrack on page 45 Figure 5 6 DTC results 1 Fix It Icon ...

Page 39: ...nd Data View Saved Data and then selecting the XML file from your saved file list Figure 5 7 When opened the XML file displays basic vehicle information and a list of DTCs with a brief description of each Figure 5 7 Typical DTC XML files in the View Saved Data list If SureTrack is active and data is available additional troubleshooting information from SureTrack e g Common Replaced Parts data Figu...

Page 40: ... OBD Health Check on page 51 z To clear codes 1 Select Clear Codes from the Codes Menu A confirmation message displays 2 Make sure any conditions shown on the confirmation message are met then select Yes A codes cleared message displays once the operation is complete 3 Select Continue to return to the Codes Menu IMPORTANT Clearing codes erases all temporary ECM information including Freeze Frame F...

Page 41: ...45 IMPORTANT PRE POST Scan Importance As many systems do not turn on the check engine light or other indicator performing a vehicle code scan before making any repairs may help in troubleshooting by identifying possible unknown issues that may be related to the present symptoms Performing pre and post scans also allows you to record in report format the pre condition of the vehicle and compare the...

Page 42: ... following Code Scan related control icons are used The following results are displayed progressively as the modules are scanned The total number of systems modules detected Figure 5 10 Figure 5 10 Code Scan systems analyzed result total A list of all the systems analyzed with DTCs totals A categorized system list with DTC totals is displayed in the order they are scanned To view the main menu for...

Page 43: ... the diagnostic tool See View Saved Data on page 119 Using ShopStream Connect See ShopStream Connect on page 145 Printing the Code Scan Report The vehicle system report can also be customized and printed using ShopStream Connect See Printing the Code Scan Report on page 149 Clear All Codes Read by Code Scan Selecting Clear All Codes Read by Code Scan erases all DTCs from all vehicle system modules...

Page 44: ... change as you scroll through the parameter list The Lock Unlock button on the toolbar selects which parameters are fixed see Locking Parameters on page 38 Pausing Data Collection You may pause the collection of data from the vehicle control module to more closely examine it When data is paused all previous frames of data stored in the scan tool memory buffer are available for review z To pause da...

Page 45: ...er 8 Frame counter current frame total frames 9 Cursor Figure 5 13 Sample paused frame of data 2 Scroll to review the data in the frame 3 To switch frames touch Previous Frame or Next Frame Each button touch moves one frame in the selected direction z To resume collecting data Touch the Record button The display changes to live data and the Pause icon is shown on the toolbar A vertical rule runs t...

Page 46: ...locked The toolbar buttons provide options for selecting and deselecting parameters to include or remove from the custom data list 2 Create a custom data list by touching the parameters to include A parameter that displays has a check mark alongside the name a parameter that does not display does not Select which parameters to display a Touching the Select All Deselect All button immediately chang...

Page 47: ...igure 5 14 Sample 4 Graph view screen NOTE i Any previously set conditions such as held data or locked lines of data remain in effect when the screen view is changed Locking Parameters Use the Lock Unlock button to hold selected lines of the data in place and prevent them from scrolling or to release previously locked lines of data Up to three lines of data may be held at a time This feature allow...

Page 48: ...e locked a parameter remains locked until it is manually unlocked or communication with the vehicle stopped Figure 5 15 Sample locked parameters NOTE i If three parameters are locked one of them must first be unlocked before another parameter can be locked z To unlock parameters 1 Scroll through the data list and highlight the parameter to be unlocked or released 2 Tap the Lock Unlock button on th...

Page 49: ...computer PC through the Mini USB port Once connected to the PC files can be printed transferred and copied using ShopStream Connect ShopStream Connect is an application that creates an interface between the diagnostic tool and a PC ShopStream Connect is a free download available at https www1 snapon com ukssc z To save a movie Select Save A save movie dialog box displays while data is being saved ...

Page 50: ...sly set trigger levels If triggers are set the menu options are Clear Trigger deletes set trigger levels for the highlighted parameter Disarm Trigger de activates event capture capability Clear All Triggers deletes all previously set trigger levels z To set trigger levels 1 Highlight the parameter to be used for triggering the recording 2 Tap the Trigger button 3 Select Set Trigger from the dropdo...

Page 51: ...are modified or are added for other parameters they are armed as soon as you exit the setting screen 5 3 3 Functional Tests The Functional Tests selection is used to access vehicle specific subsystem and component tests Available tests vary by manufacturer year and model Only the tests available for the identified vehicle display in the menu There are several types of functional tests Information ...

Page 52: ...it contains information on virtually all common diagnostic trouble code DTC problems and driveability symptoms Troubleshooter information is organized into a series of diagnostic tips that are designed to quickly lead you to the root cause of a particular problem The tips are vehicle specific which means only tips that relate to the identified vehicle are presented Selecting opens a menu that may ...

Page 53: ...cation link with the vehicle You must interrupt this communication link in order to exit from Scanner tests and power down the diagnostic tool A warning message displays if you attempt to shut down while the Scanner is communicating with the vehicle NOTE i Damage to the vehicle electronic control module ECM may occur if communication is disrupted Make sure the data cable is properly connected at a...

Page 54: ...5 1 SureTrack Operation Before you begin using SureTrack familiarize yourself with the SureTrack control icons shown below SureTrack repair information may be accessed while reviewing DTC using the Scanner function As an example navigate to Engine Codes Menu Display Codes Engine Trouble Code Information to view current DTCs and related repair information If SureTrack information is available for a...

Page 55: ...mon Replaced Parts Graph title bar Figure 5 20 Figure 5 20 SureTrack DTC results 1 Fix It Icon opens SureTrack Dashboard 2 Save Icon saves the DTCs list see Saving and Reviewing Codes on page 30 3 SureTrack Status Bar displays the active SureTrack status or result 4 Common Replaced Parts Graph Icon toggles graph display open close 5 DTC Results List displays current DTCs PSE PDVT PID 1 ...

Page 56: ...her a Tip or Real Fix for the current DTC depending on availability The Related Tips and Real Fixes icons are also available from this screen Figure 5 21 Figure 5 21 SureTrack dashboard 1 Fix It Icon 2 Related Tips Icon 3 Real Fixes Icon 4 Dashboard Exit Icon 5 Common Replaced Part Graph Icon toggles graph display open close 6 Common Replaced Part Graph 7 Real Fix 5 2 3 4 6 7 1 2000 Ford Focus 1 4...

Page 57: ...he parts listed derived from the total number of repairs by mileage The graph may display one or more replacement parts based on the captured information The example below shows a common replaced part for DTC P0106 In this example the Airflow Sensor is the most common replaced part based on 86 repairs involving vehicles with up to 200k miles From the graph it can be determined that the majority of...

Page 58: ...r every vehicle and or DTC Fixes if available can be displayed in two ways Selecting the Fix It icon Figure 5 21 from the DTC results screen opens the SureTrack dashboard which may include Real Fixes for the selected DTC If Real Fixes are not available for the DTC Tips may be displayed Selecting the Real Fixes icon Figure 5 21 displays Related and Real Fixes if available Selecting an item from the...

Page 59: ...available can be displayed in two ways Selecting the Fix It icon from the DTC results screen opens the SureTrack dashboard which may include Tip s for the selected DTC If Tips are not available for the DTC Real Fixes may be displayed Selecting the Related Tips icon will display a list of Related Tips Selecting an item from the list opens additional details about the Related Tip Figure 5 25 Tip inf...

Page 60: ...bases The Data Cable must be connected to the test vehicle and communicating with the electronic control module ECM because OBD II EOBD is a Scanner function Remember only generic OBD II information is available You must select from the Vehicle Manufacturers Menu for enhanced OBD II functions Two options are available after OBD II EOBD is selected on the Home screen OBD Health Check EOBD 6 1 OBD H...

Page 61: ... enable the scan tool to obtain pending or maturing diagnostic trouble codes These are codes whose setting conditions were met during the last drive cycle but need to be met on two or more consecutive drive cycles before the DTC actually sets NOTE i Save valuable time by using this service to verify test results after a single drive cycle following a vehicle repair and code clearing procedure If a...

Page 62: ...ous and periodic tests to check the status of emission related subsystems to gauge the integrity of the electronic operations All of the Readiness Monitors must run and complete prior to emissions certification testing Two options are available for Readiness Monitors Monitors Complete Since DTC Cleared displays the status of all monitors that have run since the last time ECM memory was erased Moni...

Page 63: ...Connector Information provides vehicle data link connector DLC location details 6 2 1 Start Communication Use the following procedure to begin an EOBD test session z To perform an EOBD Test 1 Select Start Communications from the EOBD menu A vehicle type menu displays 12V Light Duty Vehicle 24V Heavy Duty Goods Vehicle 2 Select an option from the menu A connection message displays 3 Connect the dat...

Page 64: ... DTC with Permanent Status on page 58 IMPORTANT All service modes are not supported by all vehicles so the available menu selections will vary Figure 6 5 Sample service menu 6 Select a test to continue Readiness Monitors Use this menu item to check the readiness of the monitoring system If a monitor system is not supported it is not displayed Scroll if needed to view the entire list of monitors Fi...

Page 65: ...ample current data display 02 Display Freeze Frame Data Freeze frame data provides a snapshot of critical parameter values at the time a DTC set This item is used to display freeze fame data for any stored emission related diagnostic trouble codes DTCs In most cases the stored frame is the last DTC that occurred Certain DTCs those that have a greater impact on vehicle emissions have a higher prior...

Page 66: ...DTC setting conditions detected during the last drive cycle The submenu includes 05 Oxygen Sensor Monitoring 06 On board Monitored Systems 07 DTCs Detected During Last Drive 05 Oxygen Sensor Monitoring This option opens a menu of tests available for checking the integrity of the oxygen O2 sensors Making a selection displays all of the pertinent O2 sensor parameters for the specific test The test i...

Page 67: ... record of the number of times each of the monitor tests have been completed Select Return to go back to the menu 0A Emission Related DTC with Permanent Status This option displays a record of any permanent codes A permanent status DTC is one that was severe enough to illuminate the MIL at some point but the MIL may not be on at the present time Whether the MIL was switched off by clearing codes o...

Page 68: ...tions that includes most makes and models The menu driven interface leads you quickly to difficult to find test connectors z To locate a vehicle diagnostic connector 1 Select Connector Information from the System menu A list of vehicle manufacturers displays 2 Select a manufacturer from the list A list of models available from the selected manufacturer displays 3 Select a model from the list If a ...

Page 69: ...hat the correct data can be retrieved Vehicle identification information is carried over if you enter the Guided Component Tests from Scanner or from one of the records stored in Vehicle History However you may need to enter additional attributes in some instances The vehicle identification sequence is menu driven you simply follow the screen prompts and make a series of choices Each selection you...

Page 70: ... a companion feature to the Guided Component Tests function This resource includes a wide collection of common non vehicle specific reference information and tests such as measuring fuel pump current ramp and monitoring CKP and CMP signals simultaneously Also included are basic component operation and theory information testing procedures tips definitions illustrations diagnostic tool feature desc...

Page 71: ...r performing specific tests along with drawings and tips 20 MINUTE CURRENT RAMP CLASSES provides an introduction to current ramp testing 7 2 3 Features and Benefits Selecting Features and Benefits opens a menu page that includes 5 MINUTE WALK THRU WITH DEMO BOARD explains how to use the optional demonstration board to generate sample signals and sharpen your skills Accessories opens a menu of avai...

Page 72: ...sists you in understanding the components prior to diagnosis 2 TESTS opens a pre configured meter for performing the selected test instructions for performing the test and offers tips and resources to reduce setup and testing time 7 3 1 Component Information Use the Component Information to get details on component operation z To view component information 1 Select a component from the tests list ...

Page 73: ...s The Tests section guides you through the process of performing tests on a specific component Selecting a component test gives you access to specifications tips on how and where to connect the test meter leads and configures a meter to perform the specific test z To select a test 1 Select a component from the list 2 Select a test from the component menu The component menu lists all of the tests a...

Page 74: ...there is additional information below what is shown 4 Tap the Expand Collapse on the toolbar to view the test meter only 5 Select Back on the toolbar to return to the menu Adjusting Profile The pre configured meter can be used as is for conducting most component tests However there are some instances you may want to make adjustments in order to capture a better image of circuit activity This is do...

Page 75: ... and glitches Filter removes noise and interference from the trace Invert switches the polarity of the displayed signal Coupling AC blocks the DC portion of an input signal in order to amplify the AC portion Scale adjusts the total value displayed on the vertical axis of the display Trigger switches triggering on or off and determines which slope of the trace trigger 3 Tap Profile on the toolbar o...

Page 76: ... and is typically used for measuring signals that are not rapidly changing The DMM is ideal for performing basic tests on most standard automotive circuits and displays the results in a large easy to see format To use the DMM select the Scope Multimeter icon from the home screen then select Digital Multimeter from the menu See Tests and Capabilities Quick Reference on page 70 for a list of availab...

Page 77: ...ed to the lab scope sweep scales that use relatively short time intervals e g milli and micro seconds This allows you to monitor a signal over a longer period of time when looking for erratic glitches or dropouts To use the GMM select the Scope Multimeter icon from the home screen then select Graphing Multimeter from the menu See Tests and Capabilities Quick Reference on page 70 for a list of avai...

Page 78: ...hen performing diagnostics To use the lab scope select the Scope Multimeter icon from the home screen then select Lab Scope from the menu See Tests and Capabilities Quick Reference on page 70 for a list of available testing functions Specifications Function Range Accuracy Comments Signal Measurement Ch 1 yellow jack Ch 2 green jack Each channel input is referenced to common ground GND black jack S...

Page 79: ...rement as they are more representative of DC measurements a a Ohms Measures electrical resistance opposition to current 0 to 4 M Ohms Scope supplied DC current is passed through the circuit to measure the resistance between the two connected test leads a Diode Continuity Measures voltage drop across a diode and continuity through a diode Scope supplied DC current is passed through the diode to mea...

Page 80: ...nsducer a a 100 PSI Pressure Used to measure pressures for typical systems such as fuel oil EVAP hydraulic transmission fluid etc up to 100 psi using the 0 100 psi transducer a a 500 PSI Pressure Used to measure pressures for typical systems such as hydraulic transmission fluid pressure cylinder compression and AC high side up to 500 psi using the 0 500 psi transducer a a 5000 PSI Pressure Used to...

Page 81: ...h the channel 1 jack on the diagnostic tool Figure 8 1 Yellow Channel 1 Lead This lead also includes two black right angle common ground plugs One plug is standard and the other is stackable The standard ground plug should always be connected to the ground GND jack on the diagnostic tool The stackable ground plug is used for connecting additional ground leads such as the Channel 2 or the Secondary...

Page 82: ... a signal and the CIC and COP adapters attach to the ignition coil The coil adapter lead includes a black right angle stackable ground plug and a RCA type connector that is used to connect the lead to a secondary ignition adapter The spring clamp is used to connect to a ground Figure 8 4 Secondary Ignition Coil Adapter Lead and Clip on Wire Adapter NOTE i Contact your sales representative for addi...

Page 83: ...re available for surface fluid and air temperature measurements Figure 8 6 8 3 7 Pressure Transducers and Adapters optional Different pressure transducers and adapters are available for measuring positive and negative gas and liquid pressures Depending on the adapter measurement capabilities range from 1 to 5000 psi and up to 29 inHg Measurement and application capabilities vary per device Figure ...

Page 84: ...istics by turning glitches on off helping you to become more familiar with the lab scope controls Common waveforms include AC sine wave variable frequency and pulse secondary ignition and more There are two tools currently available the standard model Figure 8 8 left and the vehicle simulator model Figure 8 8 right which produces waveforms e g Crankshaft Position Sensor CKP Camshaft Position Senso...

Page 85: ...d lab scope NOTE i Scope and Multimeter tests are not vehicle specific therefore vehicle identification is not required 8 4 1 Scope Multimeter Screen Layout and Features 1 Toolbar contains navigational and control icons 2 Data Buffer Position Indicators graphical and numerical position indicators 3 Main Body contains the meter scope display 4 Control Panel contains channel trace controls 5 Expand ...

Page 86: ... The Data Buffer Position Indicators are used to visually see the overall amount and position of the of stored buffer data during saving and playback For additional information on the Data Buffer Data Buffer Position Indicator and Saving Storing and Reviewing Data files see Saving and Reviewing Scope Multimeter Data Files on page 104 Icon Function Stop Stops the data buffer Control Panel a In full...

Page 87: ...age exceeds the input rating of the meter Figure 8 10 51 1 Risk of electrical shock Do not exceed voltage limits between inputs as indicated on the rating label Use extreme caution when working with circuits that have greater than 40 volts AC or 24 volts DC Electrical shock can cause personal injury equipment damage or circuit damage IMPORTANT If arrows are displayed in the live voltage values dis...

Page 88: ...ion are applicable with all functions z To open a scope multimeter function 1 Select the Scope Multimeter icon from the home screen 2 Select either Lab Scope Graphing Multimeter or Digital Multimeter from the menu 8 5 1 Test Lead Probe Connection Standard safety type test lead jacks are located on the top of the diagnostic tool and are compatible with many test leads and probes Insert the applicab...

Page 89: ...structions to complete the calibration Example For the ohms resistance calibration process once completed zero ohms should be displayed when the leads are connected together When the leads are separated the upward arrows on the display indicate infinite resistance or an open circuit NOTE i During an ohms test or a pressure test a manual probe recalibration can be initiated by selecting the probe i...

Page 90: ...tended as a general overview of the channel settings Not all the settings or controls described in this section are applicable with all functions some may be grayed out or not active applicable depending on the function or test Function availability is noted as applicable NOTE i The control panel can be toggled on off by selecting the Expand Collapse Icon to switch the screen between full and spli...

Page 91: ...le Y axis represents what is being measured voltage amperage pressure etc and the unit of measurement it is being measured in The vertical scale is always divided into10 major divisions how these divisions are defined sets the scale of measurement NOTE i Vertical scales either channel can be set independently NOTE i Optional vertical scale preference settings are available The Divisions option all...

Page 92: ...hanges the vertical scale to a 10V volt scale The scale is always divided by 10 therefore each division is incremented by 1V Figure 8 15 Example Selecting 50 psi displays a 50 psi scale that is divided by 10 therefore each division is incremented by 5 psi Figure 8 16 ...

Page 93: ...sweep Scale icon indicates the active sweep setting NOTE i The sweep setting applies to all channels and cannot be set independently per channel To adjust the sweep scale unit of measurement value select the Sweep Scale icon to open the sweep scale menu Select a value then press the N X button to exit the menu 1 Sweep Scale 2 Sweep Scale Menu 3 Sweep Scale Icon Figure 8 17 Example Selecting 500ms ...

Page 94: ...nformation see Test Lead Probe Calibration on page 80 Probe test Options Menu Option Probe Device Used Test Lead Volts DC Standard Channel 1 and 2 test leads with alligator clips or test probes Vacuum 100 optional 0 100 psi pressure transducer with pressure adapter Pressure 100 Pressure 500 optional 0 500 psi pressure transducer with pressure adapter Pressure 5000 optional 0 5000 psi pressure tran...

Page 95: ...ect maximizes sampling rate 5 Filter removes signal noise or interference 6 Invert switches signal polarity 7 Coupling AC blocks the DC portion of signal 8 Scale Vertical scale adjustment adjusts vertical scale 9 Trigger turns triggering on off and sets direction of trigger slope 10 Refresh clears Min Max and Live values and resets to zero 11 Min Live and Max Display Panel displays lowest highest ...

Page 96: ... memory to plot a waveform across the screen No preference is given to any point during the selection process NOTES i Turning peak detect off is suitable for basic measurements and viewing waveforms e g oxygen O2 or Cam sensor when capturing fast events is not necessary The longer the time sweep the greater the chance a glitch could be missed because it occurred in between the sample points saved ...

Page 97: ...negative directions NOTES i Turn peak detect on when capturing fast events e g ignition firing voltage glitches and intermittent events Turning peak detect on may capture unwanted noise therefore using peak detect may not be suitable for some tests e g oxygen O2 sensor as the waveform may be more difficult to evaluate due to the additional noise that may be displayed Peak Detect decreases the poss...

Page 98: ...tput of the probe The scope converts the measured output to 2 amps for display on the screen Filter GMM Using the filter with the GMM the filter minimizes noise by ignoring or smoothing out fast signal spikes For a direct measurement test such as volts amps or pressure the filter minimizes the display of very fast spikes by averaging the sampled data when filter is active For a calculated measurem...

Page 99: ... trace appear more consistent or static A trigger is basically a specific point on the display at which a trace will start to display start the sweep if it crosses that point The trigger feature allows you to set the conditions of that specific point also called a trigger point When the trigger conditions are set and a trace meets those conditions crosses the trigger point the trace will start Tri...

Page 100: ...dicated by a plus symbol on the display Figure 8 22 The trigger marker represents the trigger point and is displayed on the screen when the trigger is turned on To roughly position the trigger marker select and drag it into position using the touch screen 4 To more accurately position the trigger marker select the Trigger Position Control icon Figure 8 22 The trigger position control panel opens 5...

Page 101: ... Press the N X button to exit 1 Trigger Marker 2 Trigger Position Control Panel Figure 8 21 Trigger marker and position controls 1 Trigger Marker out of range symbol 2 Waiting for Trigger Message 3 Trigger Position Control Icon Figure 8 22 1 3 2 ...

Page 102: ...g Auto Trigger as the screen will update regardless if the signal crosses the trigger point Once the trigger point is set then switch to Manual Trigger mode z Selecting Trigger Auto Manual Mode 1 From the Control Panel on the test meter screen turn the trigger on for the desired channel 2 Select the Settings icon from the toolbar 3 Select Settings Configure Scope Meter Trigger Mode from the menu s...

Page 103: ...he signal still seems incorrect use the lab scope to verify the signal integrity and signal spacing Slow or unequal spacing will display as a band or ragged signal depending on the sweep setting Refresh Selecting the Refresh icon Figure 8 24 clears the active trace s displayed and restarts the signal tracking from zero It also clears the minimum maximum and live measurements displayed for both cha...

Page 104: ...e lab scope and Graphing Meter functions Two vertical cursors are provided that allow you to make precise signal measurements when determining signal characteristics such as amplitude at specific points and cycle time duration or frequency Using cursors can also be helpful when performing certain diagnostic tests such as O2 sensor rich lean switch time fuel injector pulse width frequency secondary...

Page 105: ...e 97 for additional information on the cursor measurements panel 2 To turn the Cursors off select the Cursor icon again from the toolbar 1 Cursors Icon 2 Cursor no 1 3 Cursor Marker no 2 4 Cursor Measurement Panel amplitude and delta display 5 Cursor Measurement Panel time and delta display Figure 8 25 z To position the cursors The cursors can be positioned anywhere within the range of the sweep s...

Page 106: ...for the time period between cursor 1 and 2 NOTE i Frequency is the number of times a signal repeats itself per second and is measured in hertz Hz The frequency value displayed is the inverse of the Delta value and can also be calculated as 1 divided by Delta The frequency value Hz shown is automatically calculated by the scope Example 1 Delta 20 46ms to get frequency divide 1 by 02046 1 02046 48 8...

Page 107: ...dually OEM specific COP adapters Ford COP 1 Chrysler COP 2 VW Audi COP 3 Acura Honda Isuzu COP 4 Volvo BMW COP 5 Mercedes Benz COP 6 Mercedes Benz Dual Type COP 7 BMW COP 8 Lexus COP 9 Chrysler Jeep Lexus Toyota COP 11 OEM specific CIC adapters GM HEI CIC 1 Toyota Honda CIC 2 z Connecting the Secondary Coil Adapter Leads 1 Connect the black ground lead into the diagnostic tool test lead ground jac...

Page 108: ... optional Scope Meter settings are available and can be set to your preference Trigger Auto Manual Mode Optional Setting on page 93 Display Grid on off on page 99 Divisions on page 100 All optional settings are available from the Tools icon located on the Home screen Select Tools Settings Configure Scope Meter to access the options menu 8 6 1 Display Grid on off The Display option allows you to tu...

Page 109: ... menu 8 6 2 Divisions The Divisions options allow you to change to your preference how the Vertical Scale Menu selections are represented and the type of value that displays in the Vertical Scale icon This section describes the following settings Trace Trace Full Scale Trace Per Division Display Display Full Scale Display Per Division The following illustration is for reference and identifies key ...

Page 110: ...u selections are represented NOTE i This setting ONLY changes the vertical scale the sweep horizontal scale is NOT changed NOTE i When adjusting the vertical scale setting it is important to remember that the vertical scale is divided into 10 major divisions and all scale adjustments reflect this factor of 10 The division set of 10 cannot be changed divisions cannot be added or removed Trace Full ...

Page 111: ...in turn changes the vertical scale to represent by division represents variable what is being measured voltage amperage pressure etc Example Figure 8 30 Selecting 1 0V div displays a vertical scale divided by 10 The vertical scale is always divided by 10 therefore each division is incremented by 1 0V thus a 10V scale Figure 8 30 ...

Page 112: ...Y changes the value displayed in the Vertical Scale icon Display Full Scale displays the value of the entire full scale Example Figure 8 31 If the vertical scale is set to 1V the value displayed is 1V Figure 8 31 Display Per Division displays the graduation value of the major scale divisions Example Figure 8 32 If the vertical scale is set to 1V the value displayed is 0 1V Figure 8 32 ...

Page 113: ... test function is selected The Data Buffer Indicator can be used to visually see the amount of stored buffer data This graphical indicator contains a slider within a bar graph The bar graph shows how much stored data is in the memory buffer The slider indicates the position of the current screen in relation to the entire memory buffer contents The Data Buffer Position Counter displays a numerical ...

Page 114: ... saved file can also be downloaded to a personal computer PC using the Mini USB jack Once connected to the PC the files can be printed transferred and copied using ShopStream Connect ShopStream Connect is a companion application that interfaces the diagnostic tool with a PC ShopStream Connect is available at no cost and can be downloaded online See the ShopStream Connect website information at the...

Page 115: ...g the conditions while capturing data Utilize the GMM to monitor the signal over longer time periods and review the histogram for possible faults z To stop and review data files Playback control icons are described in Scope Multimeter Control Icons on page 77 and Common Toolbar Control Icons on page 14 1 While viewing a waveform capturing data select the Stop icon The playback control icons are di...

Page 116: ...8 7 5 Using the Zoom Function The zoom function allows you to change the magnification level of the signal sweep during data review Changing magnification levels allows you to compress or expand multiple screens of data to quickly find glitches or signal losses Example While monitoring a MAF Mass Air Flow Sensor signal the waveform displays normally As the signal is being monitored an erratic cond...

Page 117: ...aptured on one screen Figure 8 37 Figure 8 37 Max Magnification Level displays all captured data When zoom levels of 2X and higher are selected a Zoom cursor vertical dashed line Figure 8 37 displays onscreen The cursor is used to quickly mark and navigate to points of interest or glitch in a captured waveform The Zoom cursor can be used to mark the approximate position of a glitch and can be manu...

Page 118: ... the same waveform shown in Figure 8 37 and Figure 8 38 In Figure 8 39 at 16X the glitches are easily seen as compared to higher magnification levels Figure 8 39 Example of Magnification Level at 16X For illustration purposes the Zoom cursor has been positioned in the area near the glitches 1 Waveform Glitches 2 Magnification Level at 128X 3 Magnification Level at 32X ...

Page 119: ...isted below are a few basic questions to help narrow down the testing direction to follow Are you looking to make or test a simple voltage or current level or maybe check resistance or continuity Then you may want to use the DMM Are you looking to check a circuit component for an erratic dropout or make a frequency test You may want to use the GMM Do you need to see signal details level shape freq...

Page 120: ...ng or erratic signal a signal that may flicker or drift so that it is easier to view Try and set the trigger at the mid point of the signal and then adjust as needed from there See Trigger on page 90 As all signals are different and due to other variables additional adjustments may be needed to get the signal displayed exactly how you need Review the channel settings section in this manual for add...

Page 121: ... leads are recommended Check the test lead or probes for damage Enable or disable channel controls also to help try and clean the signal Peak Detect maximizes sampling rate but may pickup unwanted noise Filter removes signal noise or interference Invert switches signal polarity Coupling AC blocks the DC portion of signal Threshold provides a more accurate measurement on select GMM tests where nois...

Page 122: ...01 V mV millivolt 1 mV 0 001 V V volt 1 V 1000 mV kV kilovolt 1kV 1 000 Volts Ohms mΩ milliohm 1 mΩ 0 001 ohms Ω ohm 1 Ω 1000 mΩ kΩ kiloohm 1 kΩ 1000 Ω MΩ megaohm 1 MΩ 1 000 000 Ω Amperes µA microamps 1 µA 0 000001 amps mA milliamps 1 mA 0 001 amps A amps 1A 1000 mA ka kiloamps 1 ka 1000 amps Frequency MHz megahertz 1 MHz 1 000 000 Hertz kHz kilohertz 1 kHz 1000 Hertz Pressure Units Symbol Descrip...

Page 123: ...95299 inHg kg cm x 98 0700 psi kg cm x 0 9807 bar kg cm x 14 2200 kPa inHg 60 x 0 0333 bar inHg 60 x 3 3770 kPa inHg 60 x 0 0344 kg cm inHg x 25 4 mmHg mmHg x 0 003994 inHg Temperature Units Symbol Description Conversions C degree Celsius C 0 556 x F 32 F degree Fahrenheit F 1 8 x C 32 Time Units Symbol Description Equivalents µs microsecond 1 µs 0 000001 of a second ms millisecond 1 ms 0 001 of a...

Page 124: ...ows in one direction only Delta Difference in time between two events Dropout An intermittent or unwanted vertical fall in a signal to zero that may cause an undesired result Duty cycle Measurement of the length of a signals on time Specified as a percentage ratio of the total cycle time Dwell Used to measure a signals on time in degrees of dwell Commonly used to measure mixture control solenoids ...

Page 125: ...ollection of signal pulses traveling together Pulse Width duration Measurement of a signals on time in a circuit that pulses on and off Specified in units of time Pulse Width Modulation PWM A signal that continuously cycles on and off while the on time varies within each cycle RMS The RMS root mean square value of alternating currents and voltages is the effective current or voltage applied rather...

Page 126: ...es a sweep VAC Volts Alternating Current VDC Volts Direct Current Vertical Scale The vertical scale on the grid or y axis represents what is being measured voltage amperage pressure etc and the unit of measurement it is being measured in Volt Unit of electric potential difference Voltage Electromotive force or potential difference expressed in volts Voltage inductive Kick A voltage many times high...

Page 127: ...sequence when performing a retest after repairs have been made The oldest vehicle record is deleted when a new vehicle is identified once there are twenty five vehicles on file Figure 9 1 Sample vehicle history list z To select from the vehicle History 1 Select Previous Vehicles and Data from the Home screen 2 Select Vehicle History from the menu A list of up to 25 previously tested vehicles displ...

Page 128: ...order by the date and time that they were created with the most recent files are at the top of the list Figure 9 2 Sample saved data list Saved files can either be opened directly on the diagnostic tool or downloaded to a personal computer and opened using ShopStream Connect z To review a movie 1 Select Previous Vehicles and Data from the Home screen 2 Select View Saved Data from the menu 3 Select...

Page 129: ...em code results are saved they are saved in XML file format Figure 9 3 Figure 9 3 Typical Code Results XML file The saved XML file s can be viewed using these methods On the diagnostic tool See Viewing Code Results on the Diagnostic Tool on page 121 In report format using ShopStream Connect see Printing the Code Scan Report on page 149 ...

Page 130: ...evious Vehicles and Data from the Home screen 2 Select Delete Saved Data from the menu A list of saved files displays NOTE i The Select All Deselect All and Delete buttons become available on the toolbar so that you can either delete individual files or clear the entire memory buffer all at once 3 Select a file from the list and a confirmation message displays 4 Select an option from the confirmat...

Page 131: ... 124 use to view configuration information for the diagnostic tool Settings on page 124 use to configure certain characteristics of the diagnostic tool 10 1 1 Connect to PC Connect to PC allows you to transfer saved data files on your diagnostic tool to your personal computer using a USB cable The optional ShopStream Connect PC software allows you to view print and save data files on your PC In ad...

Page 132: ...e 10 2 10 1 2 Configure Shortcut Key This feature allows you to change the function of the Shortcut key Options are Brightness opens the brightness setting screen Save Screen saves a bitmap image of the visible screen Save Movie saves a recording of the data buffered in tool memory Show Shortcut Menu opens the menu so you can quickly select from any of the functions Toggle Record Pause programs th...

Page 133: ...l of the data 4 Select Back on the toolbar or press the N X key to return to the options menu 10 1 4 Settings This Tools selection allows you to adjust certain basic diagnostic tool functions to your personal preferences Selecting opens an additional menu that offers the following System Settings on page 124 Configure Scanner on page 130 Configure Scope Meter on page 130 Configure Units on page 13...

Page 134: ...s on page 128 sets the time on the internal clock Daylight Savings Time on page 129 configures the clock for Daylight Savings Time Time Format on page 129 switches the time displays between a 12 or 24 hour clock Date Format on page 129 configures how the month date and year displays Brightness Selecting this option opens the brightness setting screen for adjusting the back lighting of the display ...

Page 135: ...mple Night Theme menu screen High Contrast Toolbar This option allows you to switch to a high contrast toolbar This toolbar features black and white buttons with crisp graphics that are easier to see in poor lighting conditions or bright sunlight Figure 10 6 Sample high contrast toolbar Selecting opens a menu with two choices Color Toolbar and High Contrast Toolbar Select and a please wait message...

Page 136: ...tion allows you to configure how long the screen backlight remains on when the tool is inactive The following choices are available Always On 15 Seconds 30 Seconds 45 Seconds 60 Seconds Tap the menu item desired or scroll with the keypad and Press Y a to make a selection Select Back or Home on the toolbar to return to either the Settings menu or the Home screen Touch Calibration Calibrating the to...

Page 137: ...is option opens a menu of time zone settings Scroll to highlight then select the local time zone The display returns to the Settings menu once a time zone is selected Clock Settings This option opens a window for resetting the time on the real time clock z To set the clock 1 Select Tools from the Home screen to open the menu 2 Select Settings from the menu 3 Select Clock Settings from the menu A w...

Page 138: ...k Settings window and return to the Settings menu Daylight Savings Time This option opens a menu to configure the internal clock for Daylight Savings Time Choose from ON sets the clock for Daylight Savings time OFF sets the clock for standard time Make either selection then tap the Back button or press the N X key to return to the menu Time Format This option determines whether time is displayed o...

Page 139: ... Sample scanner screen with scales hidden z To switch scanner scales 1 Select Tools from the Home screen 2 Select Settings from the Tools and Setup menu 3 Select Configure Scanner from the Settings menu 4 Highlight either menu entry to make a selection Show Graph Scale to switch the scales on Hide Graph Scale to switch the scales off 5 Tap the Back button or press the N X key to return to the Sett...

Page 140: ...ling The screen does not update if the signal does not cross the trigger threshold You can capture intermittent events because the screen only updates when the signal crosses the trigger threshold Select a menu item then tap Back or press the N X to return to the Configure Scope Meter menu Display This option switches a grid pattern on the meter screen on and off z To switch the Display 1 Select T...

Page 141: ...ghlight either menu entry to make a selection Trace Settings to change the Scale menu selections from Full scale 20V to Per division values 2 0 V Div Display Settings to change the value of the scale selected which is displayed in the profile area from Full scale 20V to Per division values 2 0 V Div b Select from the menu Full Scale one unit per screen Per Division ten units per screen c Tap the B...

Page 142: ...e units setup 1 Select Tools from the Home screen to open the menu 2 Select Configure Units to open the menu 3 Select an item from the Configure Units menu 4 Select a setting from the listed choices 5 Select Back on the toolbar or press the N X key to return to the options menu ...

Page 143: ...abrasive cleansers or automotive chemicals on the touch screen 11 2 Battery Service Follow all safety guidelines when handling the battery pack 51 1 Risk of electric shock Prior to recycling the battery pack protect exposed terminals with heavy insulating tape to prevent shorting Disconnect all test leads and turn diagnostic tools off before removing the battery pack Do not attempt to disassemble ...

Page 144: ...ith a 30 to 75 percent state of charge to prevent loss of characteristics To prolong the life of your battery power off the unit when not in use The diagnostic tool has a built in charger that recharges the battery on demand whenever it is connected to a power source 11 2 2 Replacing the Battery Pack If the battery pack no longer holds a charge contact your sales representative to order a new one ...

Page 145: ...s contain recyclable materials If shipping is required ship the battery pack to a recycling facility in accordance with local national and international regulations For additional information contact United Kingdom Electrical Waste Recycling Company at http www electricalwaste com Products bearing the WEEE logo Figure 11 2 are subject to European Union regulations Figure 11 2 sample WEEE logo NOTE...

Page 146: ...mation on Wi Fi connection and troubleshooting Main Topic Links Checking if Wi Fi is On Off page 137 Checking if Wi Fi is Connected page 138 Wi Fi Icons Setup page 138 Turning Wi Fi On and Connecting to a Network page 138 Add Network Advanced Connecting to a hidden network page 140 Wi Fi Testing page 140 Wi Fi Troubleshooting and Status Messages page 142 12 1 Checking if Wi Fi is On Off If the Wi ...

Page 147: ... 1 to turn Wi Fi on Figure 12 1 Wi Fi Icon shown off 3 The Wi Fi icon will change to the Wi Fi symbol with x mark Figure 12 2 indicating Wi Fi is on Wi Fi is on and connected to a network 1 to 3 bars Wi Fi is on but not connected zero bars See Wi Fi Troubleshooting and Status Messages on page 142 Wi Fi Icon toggle type Wi Fi Test Icon Wi Fi Signal Strength Indicator Select to turn Wi Fi ON Select ...

Page 148: ...tworks with a proxy challenge page or that require the user to accept terms of usage are not supported Wi Fi performance varies depending on your wireless network equipment and ISP 5 Select Connect to connect to your desired network or Cancel to cancel the request 6 From the Connect confirmation screen select OK to continue using this connection or Forget to disconnect this connection The screen w...

Page 149: ...ist 3 Select security type Open WPA WPA2 or WEP Refer to the router user manual or your IT administrator to determine the type 4 Enter the network name or SSID 5 Enter the network password 6 Select Connect at the prompt to connect to the network 7 Select OK at the confirmation screen to continue using this connection or Forget to disconnect this connection 12 6 Wi Fi Testing If you are experiencin...

Page 150: ...Web Services Network Figure 12 4 Connection Tests 1 Connection Tests 2 View Summary 4 If a connection issue s is present select View Summary to review the results The summary information is helpful if you are experiencing difficulties with your connection Figure 12 5 Scroll through the summary information to review the test results for each system and Tip messages for the current connection issue ...

Page 151: ...ment Snap on Incorporated is not responsible for any costs incurred for any additional equipment labor or consultation charges or any other costs that may result from correcting non connectivity issues with this device Check Router Settings Verify the following router settings BEFORE you begin troubleshooting a non connectivity or No Connection problem After each check make any corrections as nece...

Page 152: ...adio is on 3 Connect to a known good network Not connecting to a network 1 Clear saved Wi Fi networks see Clearing Wi Fi Networks on page 142 2 Connect to a network 3 From the Configure Wi Fi screen select the Wi Fi Test icon and review the results See Connection Tests Troubleshooting in the following table Wi Fi connection drops off or disconnects intermittently Wi Fi Signal strength insufficient...

Page 153: ...Sales representative to renew indicates your access to the Web Services Network has expired and you should contact your sales representative Router This device is not connected to a router Check Wi Fi signal strength out of range or interference Move closer within 50 Ft 15 M or into a direct open sight line of the router or if applicable remote wireless access point Eliminate interference from ove...

Page 154: ... to share the data in a report format with vehicle owners or other technicians Add or edit notes and comments to diagnostic tool data files Download and install diagnostic tool software updates and upgrades The ShopStream Connect SSC software is available free of charge at ShopStream Connect https www snapon com diagnostics UK Diagnostics ShopStreamConnect htm 13 1 Using SSC Connecting to your PC ...

Page 155: ...om the menu bar to save your notes NOTE Not all file types allow notes the Notes window will be grayed out when a file type that does not support notes is highlighted Some image files may display notes for reference purposes the notes are grayed out and not editable 2 File directory structure displays the file directory structure of your PC in standard Windows format and shows any connected diagno...

Page 156: ...er DataViewer SSC allows you to view data files recorded with your diagnostic tool on your PC When a Scanner data file is selected it opens and displays in the Scanner DataViewer Figure 13 3 Scanner DataViewer allows you play the data file and custom configure the data in a number of ways Figure 13 3 1 Menu bar 2 Display toolbar 3 Graph display 4 Properties icon 5 Vertical Scroll bar 6 Zoom contro...

Page 157: ...diagnostic tool with your PC NOTE i File extension types vary depending on the diagnostic tool Not all the file extensions described here may be available on your diagnostic tool Figure 13 4 1 Exit closes the Image Viewer 2 Print prints the image 3 Print Preview allows the image to be previewed before printing 4 Captured Screen Image 4 3 1 2 ...

Page 158: ...opened using ShopStream Connect To print the Code Scan Report using ShopStream Connect 1 Double click the code scan XML file from the file list to open the report Figure 13 5 in the Code Scan Viewer Figure 13 6 Figure 13 5 2 Select Print or Print Preview from the Code Scan Viewer menu to print or preview the report Figure 13 6 Figure 13 6 Diagnostic Tool ...

Page 159: ...m Connect Printing the Code Scan Report Selecting Print opens the Windows print dialog window Figure 13 7 Select your printer from the list then select Print to print the report Figure 13 7 My printer 1 My printer 2 ...

Page 160: ...nstalled on your PC and have connection to the Internet z Example Updating diagnostic tool software 1 Select Tools Update Software diagnostic tool type e g ETHOS Edge MODIS Edge SOLUS Edge etc from the Menu bar Figure 13 8 The software checks the Snap on web server for available updates Figure 13 8 2 If service release updates are available select Next to continue then select Download and follow t...

Page 161: ...should not be initially operated until the End User License Agreement is read Use of the device acknowledges your acceptance of the End User License Agreement The Snap on Incorporated Software End User License Agreement is available at https eula snapon com diagnostics To Accept at the screen prompt Figure 13 10 click the checkbox on the left side of the window and then select Agree and Continue T...

Reviews: