34
Scanner Operations
Operations
z
To adjust the amount of data collected after a trigger:
1.
Tap the Properties button on the Scanner toolbar to open the dialog box.
2.
Highlight one of the Samples After Trigger options:
3.
Tap the Accept button to close the dialog box.
NOTE:
i
You can also adjust the amount of data collected after a triggering event using the Properties
button on the Scanner toolbar. See
on page 44 for additional information.
z
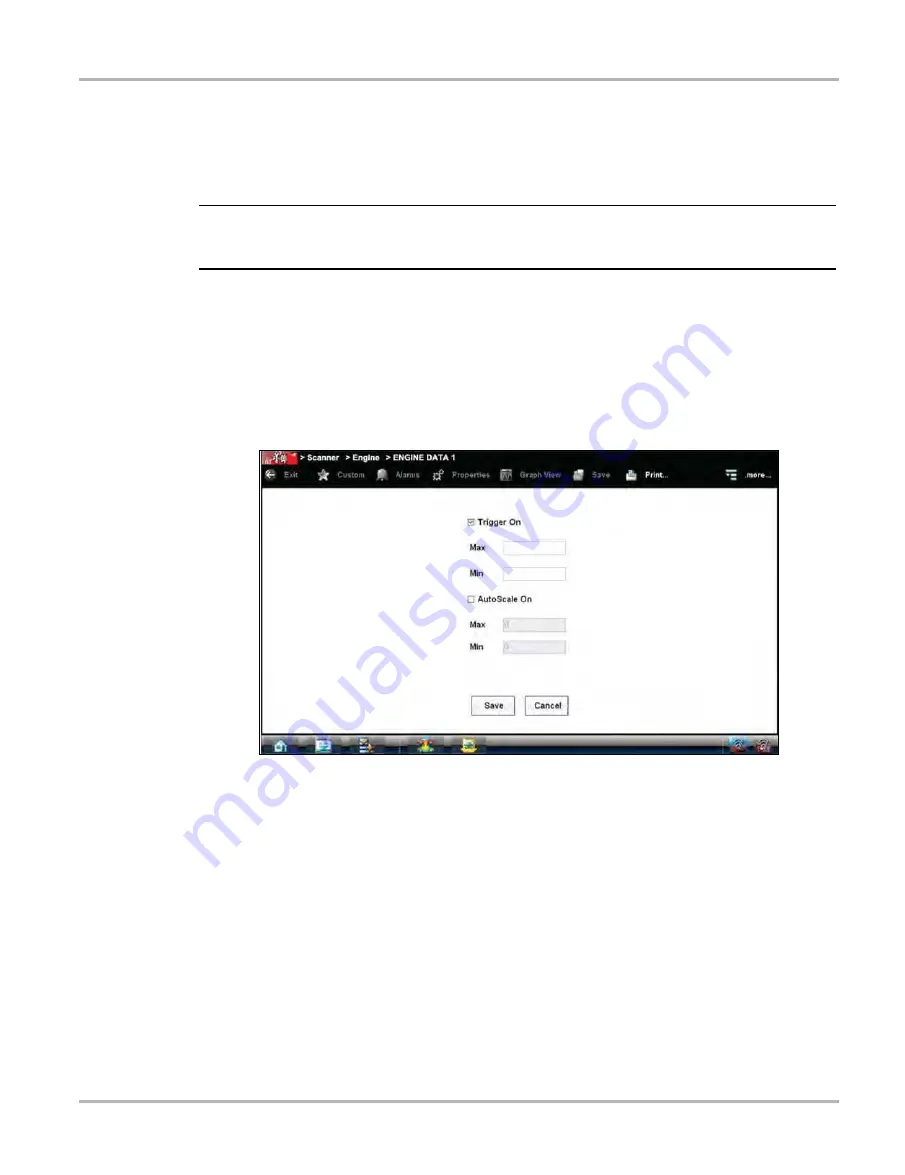
To set triggers and record a snapshot:
1.
Tap the Graph Properties icon on the parameter graph you wish to set triggers on.
The Graph Properties dialog box opens.
2.
From the Graph Properties dialog box, tap Triggers On.
A check mark appears in the box and the minimum and maximum fields activate
(
).
Figure 5-15 Sample Graph Properties dialog box
3.
Tap either Max: (maximum) or Min: (minimum) to activate that field and open the keyboard.
4.
Type the desired trigger value into the field.
5.
Tap the other field and enter a trigger value, then close the virtual keyboard.
6.
Tap Save to close the dialog box.
Trigger lines (blue for upper and red for lower) display on the selected parameter graph.
The area between the upper and lower trigger lines establishes the triggering condition. Once
the snapshot is armed, any data points that register outside of the set trigger conditions
initiates a snapshot. The Scanner continues to record the preset amount of data after the
trigger and includes it in the snapshot.
7.
Tap Snapshot on the Data Buffer Toolbar to arm the snapshot.
The Snapshot button changes color to indicate it has been armed (
).


