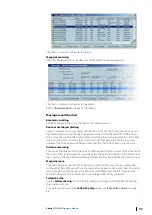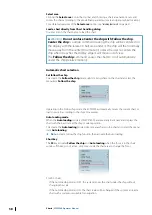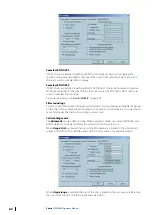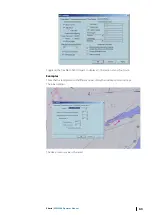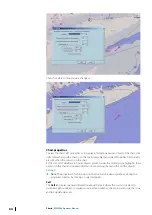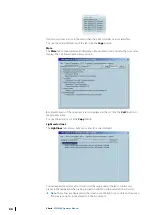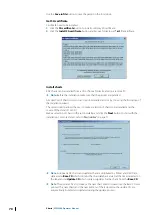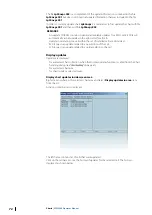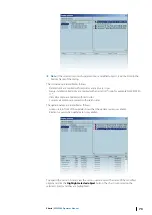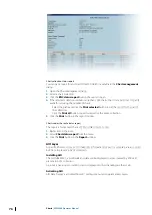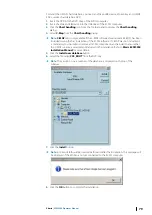
Then, the Safety contour value is changed.
Chart properties
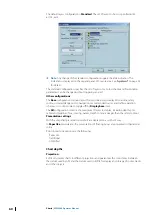
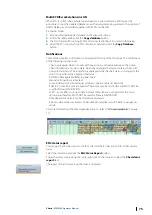
To view the chart cell’s properties or to display information about an object of the chart, click
right somewhere on the chart or on that particular object and select Properties. Alternatively
press F4 when the cursor is on the chart.
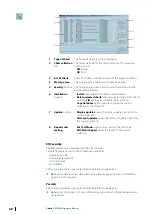
ECDIS scans ENC database to find all objects present under the clicked point, highlights these
objects on the chart and displays information concerning them and the cell the objects
belong to.
Ú
Note:
The properties of other points on the chart can be viewed, without closing the
properties window, by clicking on selected points
Cell
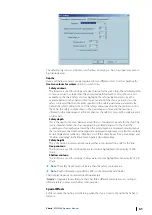
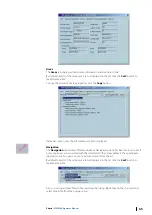
The
Cell
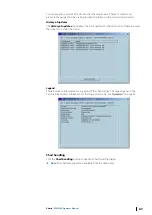
tab displays general information about that cell, where the cursor is located. In
particular cell boundaries, compilation scale, edition number, the version and Issue, the Issue
and last update dates, etc.
64
Charts
| ECDIS900 Operator Manual


