background image


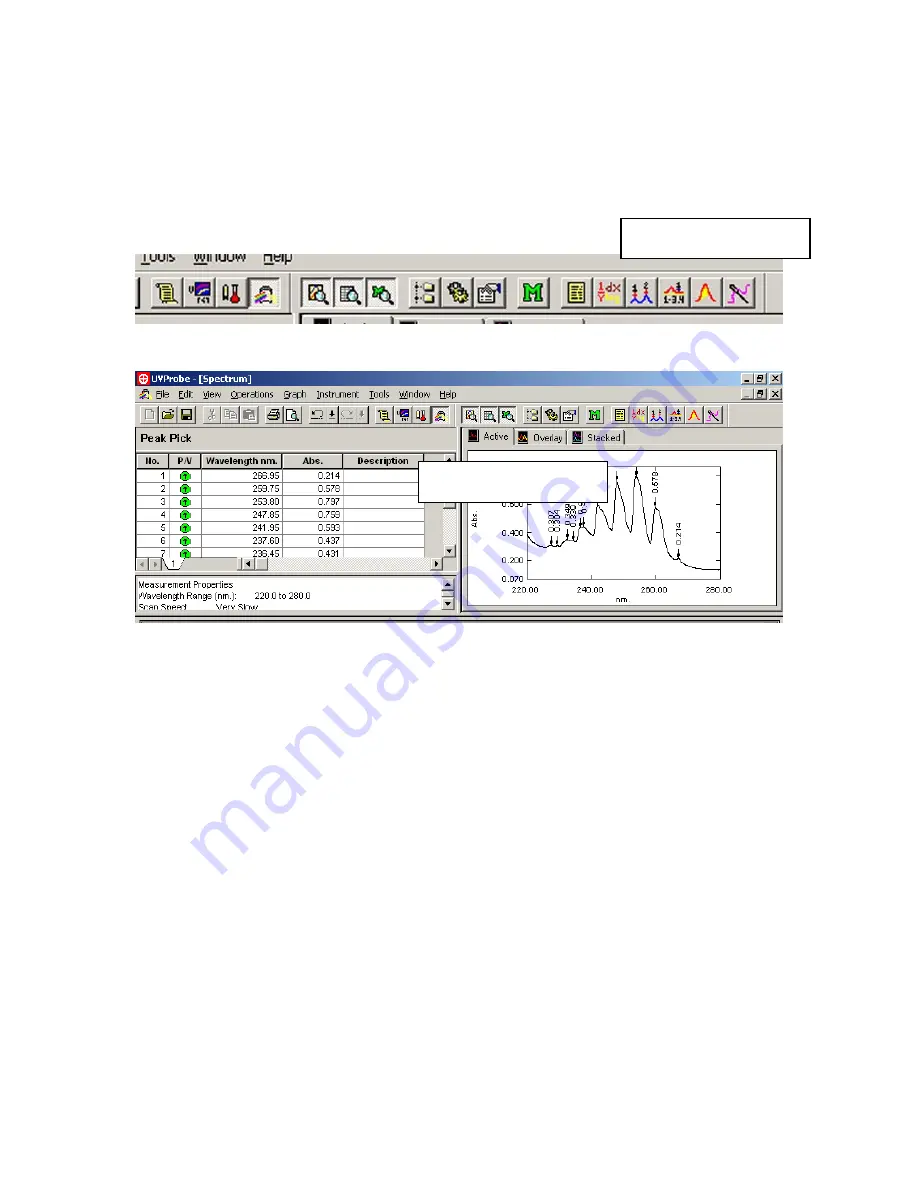
How to label peaks on your spectrum: 

Click on the Peak Pick button on the toolbar. 


¾

 Peak Pick button 

 
The Peak Pick table will then appear on the left side of the screen. 


»

 Peak Pick Table 

 
Right-click the mouse on the Peak Pick table, and left-click on Properties. 
You can then change parameters, such as the threshold for labeling peaks, and whether 
the graph is labeled with the peak table number or the actual absorbance value, and 
whether peaks or valleys are labeled. 
 
After you have set up the Peak Pick table the way that you want, click on the Peak Pick 
table to make it the active window.  Then click on File, Print Preview.  The report 
generator will show you how the printout will appear.  If it looks ok, then click on Print.   
 

Please Note: 
If the spectrum graph is selected as the active window, you will get a different 
looking report than if the peak table is selected as the active window, prior to 
clicking on Print Preview. 

Summary of Contents for UV-VIS

Page 1: ...VIS instrument keypad This will enable PC control Push the F4 Button 2 Log into the UV VIS software with your username and password 3 After the UV Probe software comes up click on the Connect button near the bottom of the screen to connect with the spectrometer ...

Page 2: ...ous wide range Photometric mode is for quantitative analysis measuring absorbance at single wavelengths Kinetics mode will collect absorbance data at a particular wavelength versus time 5 Choose the mode you need by clicking on one of the buttons on the toolbar Photometric Edit Method Kinetics Spectrum ...

Page 3: ...range and scan speed usually fast and click on OK The maximum allowable wavelength range is 1100 nm to 190 nm 3 It s good practice to zero the baseline by clicking on the Baseline button near the bottom of the screen Be sure that there are no samples in either the sample or the reference side while correcting the baseline And the cover must be closed of course ...

Page 4: ...llected the program will prompt you for a filename However this does not automatically save your spectrum to disk You must then do a File Save As in order to permanently save the spectrum to a disk file To change the appearance of your spectrum such as the display limits or the background color right click the mouse on the spectrum graph and left click on Customize Please Note If your peaks of int...

Page 5: ...beled with the peak table number or the actual absorbance value and whether peaks or valleys are labeled After you have set up the Peak Pick table the way that you want click on the Peak Pick table to make it the active window Then click on File Print Preview The report generator will show you how the printout will appear If it looks ok then click on Print Please Note If the spectrum graph is sele...

Page 6: ...will appear listing the raw data points Click on Data Print Button Data Print Table Appears Right click the Data Print table and left click Properties Make sure that the option All Data is clicked on otherwise all of the data might not be included in the ASCII file Make sure All Data is selected ...

Page 7: ...ile menu and Save As Navigate to the folder where you want to save the data For Save As Type click on the drop down menu and select Data Print Table txt Give it a file name and click on OK Select Data Print Table txt ...

Page 8: ...nnect button near the bottom of the screen Exit from the UV Probe software Important Please go to the UV VIS instrument keypad and push the Mode button to return local control to the spectrometer This allows the instrument to turn off the deuterium lamp which will make the lamp last longer Push the Mode Button ...

Page 9: ...M button to change your method parameters Method edit button Photometric button The following pages will come up to set up your experiment The first page lets you enter which wavelengths you want to use Type in your wavelength here Then click add The next page lets you set the concentration units and the type of standard curve fit ...

Page 10: ... Choose the wavelength to use for calibration Set standard curve fit order The next page lets you enter measurement parameters for your standards Be sure to click on Data Acquired By Instrument Be sure Instrument is clicked on ...

Page 11: ...The next page lets you set sample measurement parameters Again make sure that Data Acquired By Instrument is clicked on Be sure Instrument is clicked on ...

Page 12: ...ve It is a good practice to click on the Baseline button with nothing in either the reference or the sample side of the compartment Be sure that the sample lid is closed This will set the absorbance to zero at every wavelength Then put cuvettes with blank solution in both the sample and reference sides and click on Cell Blank with the lid closed This will read the absorbance of the blank cells Thi...

Page 13: ...nnect button near the bottom of the screen Exit from the UV Probe software Important Please go to the UV VIS instrument keypad and push the Mode button to return local control to the spectrometer This allows the instrument to turn off the deuterium lamp which will make the lamp last longer Push the Mode Button ...

Reviews: