


22
Pairing
ABS with
turbidity
By combining the complementary characteristics of the optical and acoustic
measurements, the LISST-AOBS provides better tracking of total sediment
concentration than either measurement alone. We can define a combined
concentration measurement,
C
AOBS
, as follows:
C
AOBS
=
C
ABS
+
P
* (
V
OBS
–
V
0
)
where
C
ABS
is the concentration reported by the LISST-ABS, in mg/l
V
OBS
is the voltage from the turbidity sensor
V
o
is the voltage from the turbidity sensor in clean water
P
is the pairing factor in mg/l/V
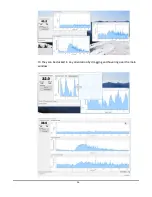
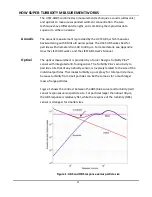
Intuitively, we can see from Figure 1 that adding the two sensor responses will
produce a curve that is “flatter” than either curve alone
, but it is not obvious
what value of
P
is optimum. From a combination of theory and experiment, we
find that the optimum pairing factor is
P
=
C
ABS
/
V
OBS
when measured with particles of 30 µm diameter, and with a high enough
concentration to make the clean-water offset
V
0
negligible. Put another way,
P
should have the value that equalizes the acoustic and optical contributions to
C
AOBS
from 30 µm particles.
Measuring
Pairing
Factor
To determine the pairing factor P in practice, we immerse the AOBS sensors in
a suspension of natural particles (Arizona Test Dust) filtered to a range of 20 to
40 µm, that is, centered on the 30 µm optimum size cited above. The outputs
of the two sensors provide
C
ABS
and
V
OBS
, and the ratio of those values is the
pairing factor
P
.
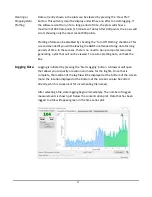
Pairing
Results
Figure 2 shows the response of a properly paired AOBS sensor to a wide range
of particle sizes and concentrations. While obviously imperfect (perfect data
would lie on the diagonal blue line), these results are vastly superior to what
could be expected from a simple turbidity measurement.


