


Cambridge Sensotec Rapidox 1100ZR-H-PFC-E O
2
Analyser Instruction Manual
Version 1.2
35
Last printed 22/07/2015 18:08:00
9.8
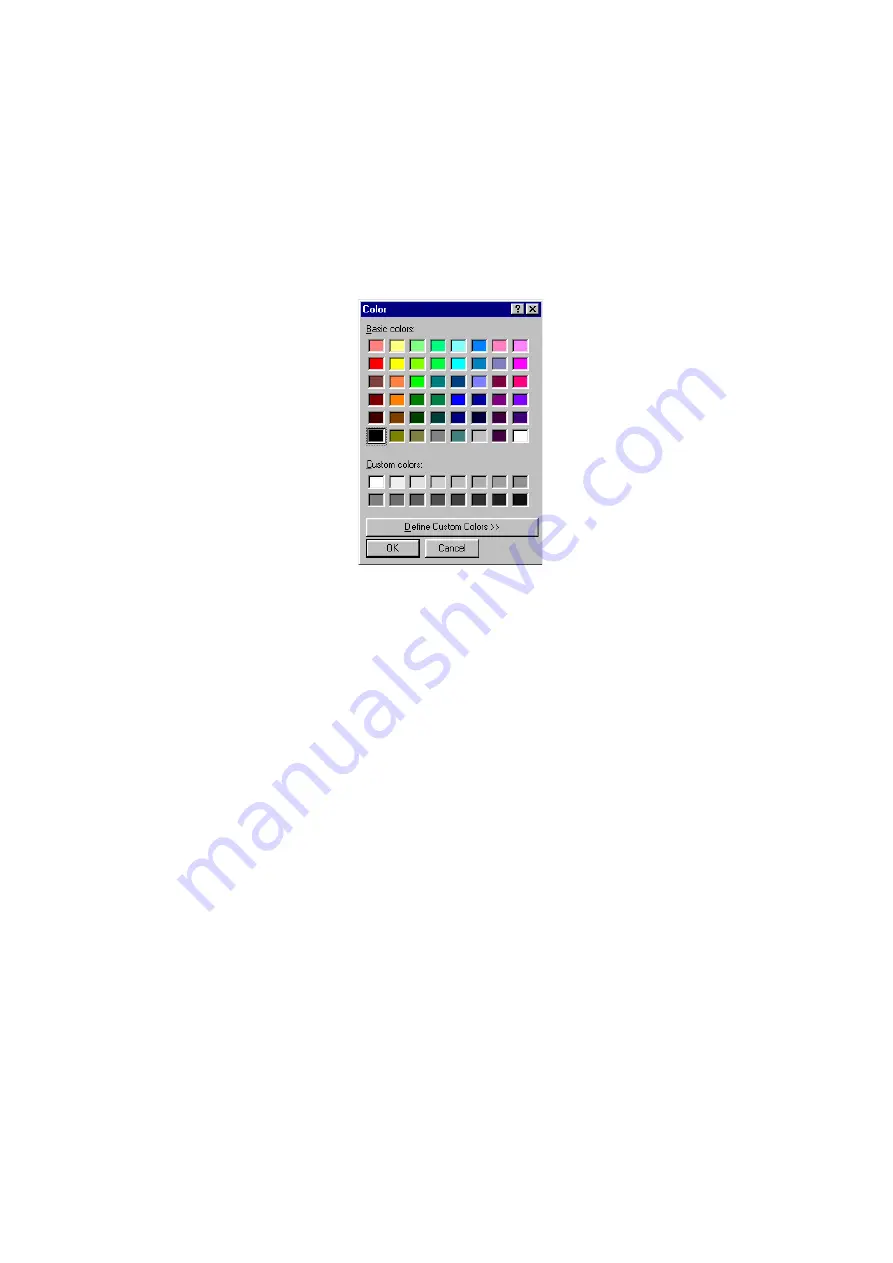
Plot Colours
The default colours used on the graph are set to blue for oxygen and red for
pressure. To change the colours double-click on the coloured axis label at the top
of each axis. A colour palette window will appear (see Figure 21) and a new
colour can either be chosen from a colour box, or for more variety, by clicking the
‘Define Custom Colors >>’ button. Click on ‘OK’ to select the new colour or
‘Cancel’ to return to the graph without change.
Figure 23: Plot colour palette menu accessed by double-clicking on the axes titles.
9.9
Graph Titles and Labels
If you want to change the text of the graph axis labels, place the mouse pointer
over the text and do a single left click to enter edit mode. The text can then be
modified. Similarly, to change the title of the graph, place the mouse pointer over
the title and click once to edit. If you choose not to enter a title the graph will
display the path and filename of the run as the new title once the run has
finished. Note that these changes are only temporary and will be overwritten by
the defaults if a new run is started or the graph window is closed and reopened.
They are provided so that the plot may be printed with alternative labels.
9.10
Plot Co-ordinates
The box labelled ‘Plot co-ordinates’ to the upper left of the graph window displays
the actual plot co-ordinate value at the mouse pointer. This can be used to get a
quick oxygen value from the graph. Simply place the mouse pointer at a place of
interest and read the corresponding X1 and Y1 values in the box.
9.11
Last data point
During data acquisition, the box labelled ‘Last data point’ will appear at the upper
middle of the graph window. It displays the last data values read from the