


Cambridge Sensotec Rapidox 1100L Oxygen Analyser Instruction Manual
And so on. Combined together they represent all the data over the last seven days.
Note that the Rapidox uses the computer clock and date to perform this action, so
make sure that they are correct before starting a run.
To view the data in its entirety the user would, for example, need to load each file
in turn back into Excel to combine them.
9.5
Live-time Graphing Screen
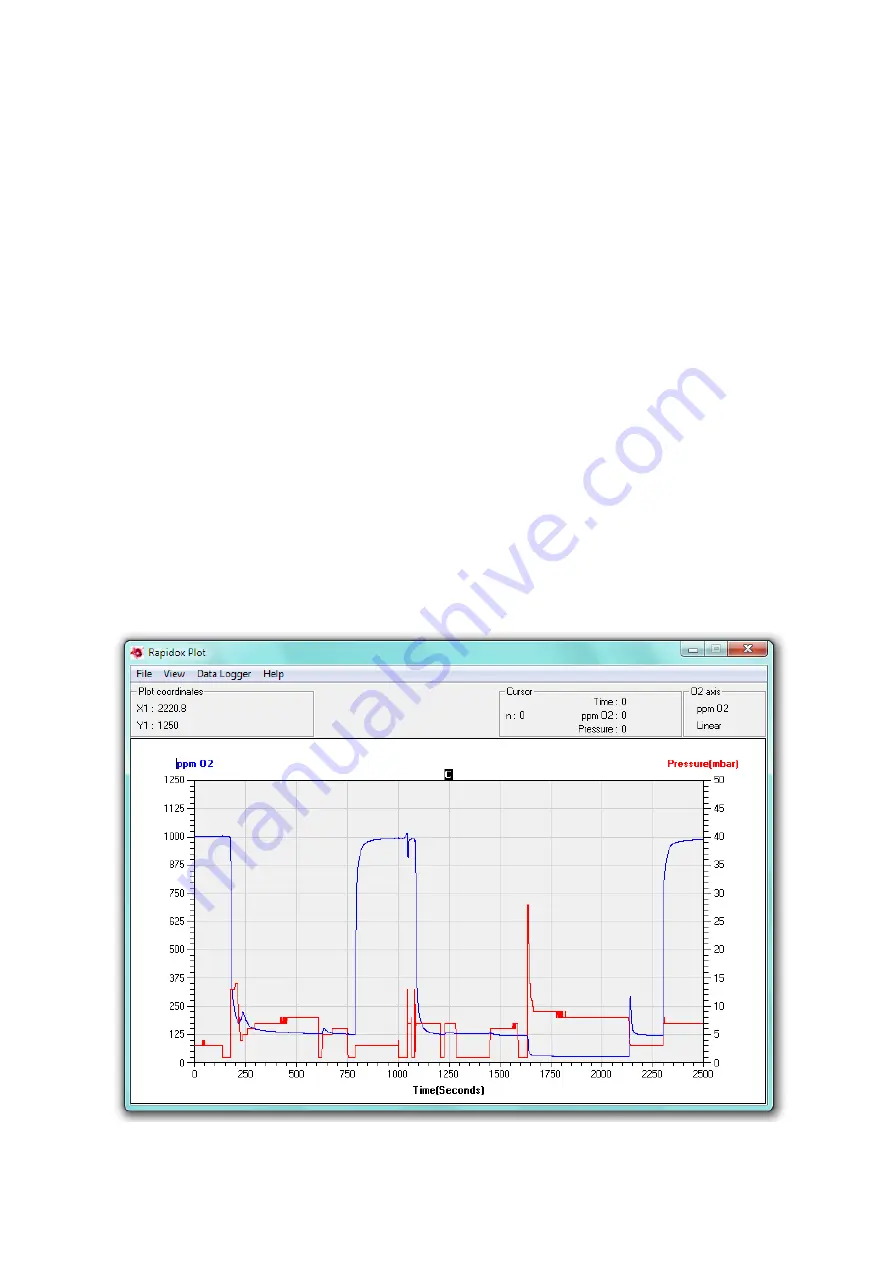
The Rapidox data-logging package includes a live-time graphing facility that
allows you to monitor the progress of your data in a graphical format (see Figure
18). To access the graph check the box labelled ‘Show Plot’. The graph will
appear in a new window, and can be accessed at any time without disturbing a
run that is already in progress. You can select ‘Run’, ‘Pause’ and ‘Stop’ from the
‘Data Logger’ menu on the ‘Rapidox Plot’ window to begin, pause and end data
logging, and the window can be minimised to (and restored from) the task bar
while logging data.
To close the window and return to the main data-logging page select ‘Close Plot’
from the ‘File’ menu or click on the close window button. You can also close the
plot from the main window by un-checking ‘Show Plot’. The features of the graph
window are described below:
Figure 18: Live-time graphing screen
Version 1.6
32
Last printed 16/11/2011 16:59:00