889-2106-03
Model U-1400 Operations Manual Rev Apr 2020 Page
34
of 39
5.10
LOOP FAIL INDICATIONS
If the total inductance of a channel’s loop input network goes out of the
range specified for the detector, or rapidly changes by more than ±25%,
the loop input channel will enter the Fail-Safe mode and display
LOOP
FAIL
on the LCD. The type of loop failure will also be displayed as
L lo
(for -25% change or shorted loop conditions) or
L hi
(for +25% change
or open loop conditions). This will continue as long as the loop fault
exists. Fail-Safe mode generates a continuous call. At the time of a loop
failure, the loop input channel’s LED will begin to flash at a rate of three
flashes per second. The LED will continue this display pattern until the
channel is manually reset or power is removed.
If the loop self-heals, the
LOOP FAIL
message on the LCD will
extinguish and the loop input channel will resume operation in a normal
manner; except, the LED will continue the three flashes per second
display pattern, thus, providing an alert that a prior Loop Fail condition
has occurred. Each loop failure is counted and accumulated into the
Loop Fail Memory. The total number of loop failures for the loop input
channel (since the last power interruption or manual reset) is written into
the Loop Fail Memory and can be seen by stepping through the channel’s functions in Program Mode to the
LOOP
FAIL
display.
This is a useful tool to identify intermittent loop problems. If the count is extremely high for the period of time
observed, the problem is very likely a loose connection (check for loose connections at the terminal strip and bad
splices in the field). The Loop Fail Count is reset when power is removed from the detector. This prevents the
Loop Failure Count from moving to another loop if the detector is moved to a new location.
To view the Loop Fail Count, select the desired loop input channel using the
CHAN
pushbutton then repeatedly
press the
FUNC
pushbutton until the
LOOP FAIL
display is shown. The Loop Fail Count display is after the
Option displays. Pressing the
(UP) or
(DOWN) pushbutton while the Loop Fail Count is displayed, will
reset the count to zero.
5.11
SETTING SENSITIVITY USING THE BARGRAPH
The bargraph is a graphical representation of the relative change of inductance as seen by the detector loop input
channel; automatically taking into account sensitivity setting, loop geometry, configuration, lead-in length, etc.
The first bargraph segment represents the minimum inductance change (set by the sensitivity level) necessary for
the loop input channel to output a call. Each additional segment represents the inductance change in excess of the
next sensitivity threshold. Usually, the larger the vehicle detected, the more bargraph segments displayed, i.e. the
greater the -
∆
L/L. The bargraph can be used to select the proper sensitivity level.
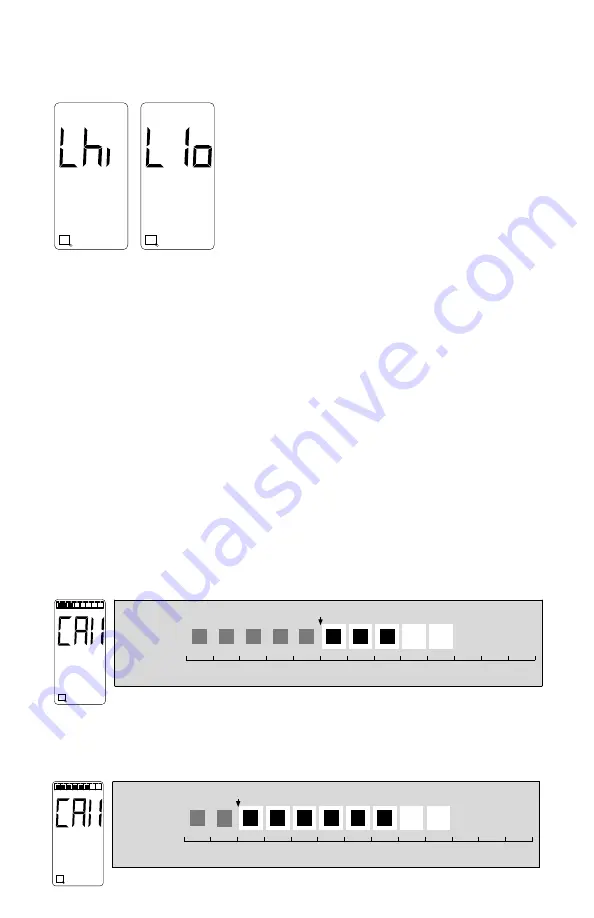
The bargraph below shows the deflection (3 segments) of a vehicle with Sensitivity set to Level 5. The vehicle in
the loop zone is causing a change of inductance greater than 1.28% -
ΔL/Lor Sensitivity Level 3.
The bargraph below has the same vehicle in the loop zone causing the same inductance change as above. Because
the sensitivity setting was increased to Level 8, six segments are now displayed. If the bargraph displays 5 or 6
segments for a vehicle in the loop, the sensitivity has been set to the proper range.
+25% change
or open loop
condition.
-25% change
or shorted loop
condition.
LOOP FAIL
1
©
LOOP FAIL
1
©
SENSITIVITY 10 9 8 7 6 5 4 3 2 1
% of Inductance
0.01 0.02 0.04 0.08 0.16 0.32 0.64 1.28 2.56 5.12
The Bargraph is a window that adjusts to the sensitivity setting.
1
©
SENSITIVITY 10 9 8 7 6 5 4 3 2 1
% of Inductance
0.01 0.02 0.04 0.08 0.16 0.32 0.64 1.28 2.56 5.12
The Bargraph is a window that adjusts to the sensitivity setting.
©


