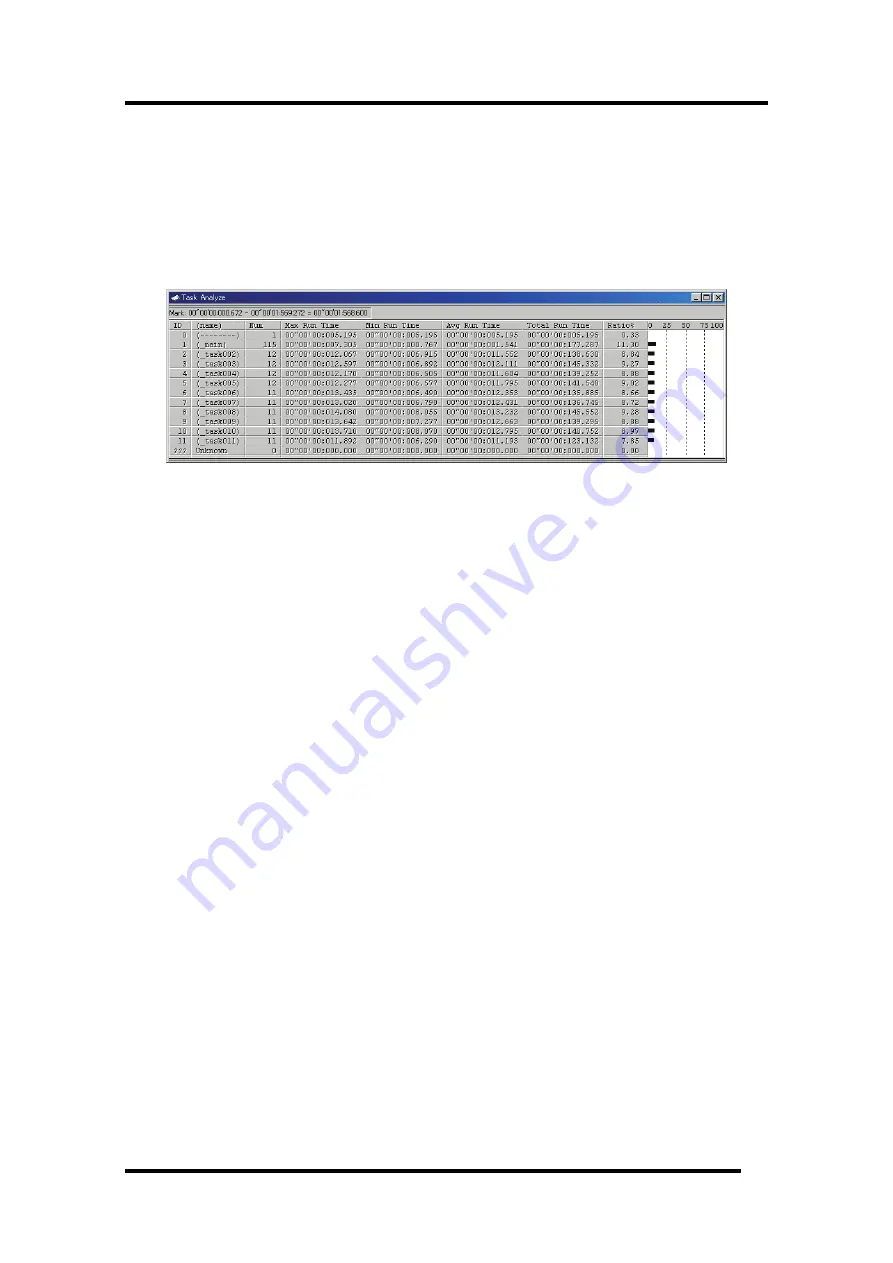
7.19.2 Analyze the Execution History of Task
You can reference the execution history statistical processing in the Task Analyze window. This
window shows the CPU occupation time and ratio by task.
The Task Analyze window functions together with the Task Trace window. If the Task Trace window
is not open, or the Task Trace window does not show any data, the Task Analyze window will not
function.
The displayed data is the statistical results of the range specified by the start marker and the end
marker in the Task Trace window.
By clicking the maximum ready time/minimum ready time display field of each line, you can search
the processing history at the maximum ready time/minimum ready time of the task corresponding to
the clicked line.
The search result is pointed by the indicator in the Task Trace window after the indicator moves to
the destination position.
238
Summary of Contents for Emulator Debugger M16C PC4701
Page 13: ...Setup of Debugger 1...
Page 14: ...Blank Page 2...
Page 73: ...Tutorial 59...
Page 74: ...Blank Page 60...
Page 95: ...Reference 81...
Page 96: ...Blank Page 82...
Page 128: ...Example Writing byte length data 32h to even address 400h 114...
Page 130: ...16 bits bus width 116...
Page 132: ...2nd point 118...
Page 133: ...7 Windows Dialogs 16 bits bus width 119...
Page 134: ...Example Writing data 10h 3Fh to even address 400h 120...
Page 138: ...Example Writing byte length data 32h to even address 400h 124...
Page 140: ...16 bits bus width 126...
Page 141: ...7 Windows Dialogs Example Writing word length data 1234h to even address 400h 127...
Page 142: ...Example Writing data 10h 3Fh to even address 400h 128...
Page 146: ...Example Writing byte length data 32h to even address 400h 132...
Page 147: ...7 Windows Dialogs Example Writing data 10h 3Fh to even address 400h 133...
Page 153: ...7 Windows Dialogs 7 7 8 2 Interrupt Termination Set as below 139...
Page 172: ...For condition 7 choose the Mode shown below and set the Start event 158...
Page 294: ...MEMO 280...


