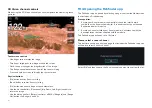
3.
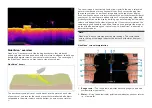
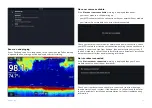
Centerline
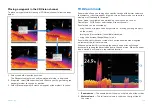
— The solid line represents the centerline of your vessel. left
of the centerline represents the water, objects and bottom to the port
side of your vessel, right of the centerline represents the starboard side.
4.
Turbulent water
— turbulence in the water caused by such things as
vessel wake can produce a sonar return due to the aeration in the water.
5.
Water depth
— When using a separate depth transducer current depth
can be displayed in a data overlay.
6.
Vegetation
— Examples of vegetation growth (e.g: trees) on the bottom.
7.
Bait ball
— Example of a bait ball at an approximate distance of 18.5
ft from your vessel.
8.
Structure
— Example of bottom structure. Underwater structures such
as pipelines, piers and other large solid structures may cause an area of
shadow directed away from your vessel’s direction.
9.
Vessel direction
— Vessel direction of travel. The sonar image will scroll
from top to bottom as your vessel moves.
10.
Bottom
— Solid mass indicating the bottom, using the default color
palette the bottom is colored copper. It may be possible to identify
the transition of bottom material (e.g.: where an area of mud meets an
area of gravel).
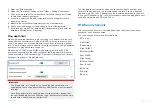
RealVision™ 3D overview
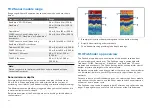
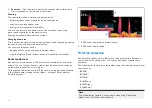
RealVision™ 3D and RealVision™ Max 3Dtransducers produce life-like 3D
sonar imagery. When using a RealVision™ 3D or RealVision™ Max 3D
transducer the
[3D Vision]
channel will be available in the Fishfinder app.
RealVision™ 3D and RealVision™ Max 3D transducers are also capable of
producing DownVision™, SideVision™ and CHIRP conical sonar channels.
3D Vision provides a true, easy-to-understand view of bottom topography,
debris, and fish.
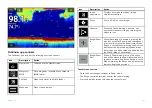
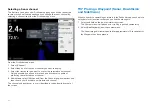
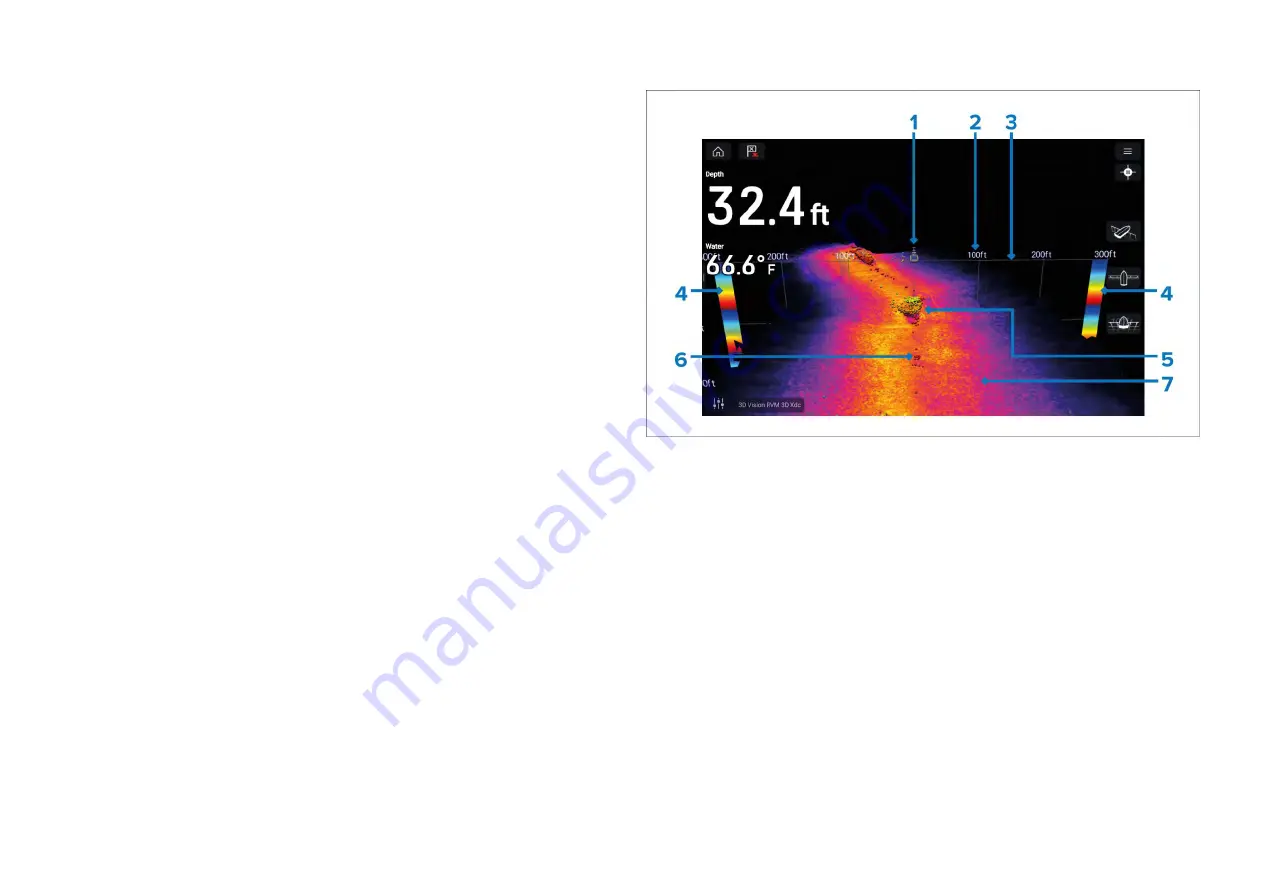
3D Vision screen interpretation
1.
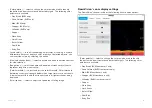
Vessel location
— The vessel icon indicates location and direction of
your vessel.
2.
Range scale
— The range scale indicates distance (range) to port and
starboard from your vessel.
3.
Water line
— The line represents the top of the water.
4.
Depth indicator
— Provides an indication of object depths.
5.
Structure
— Example of bottom structure. Underwater structures such as
pipelines, piers and other large solid structures.
6.
Sonar returns
— Sonar return/detected object.
7.
Bottom
— Solid mass indicating the bottom. It ––may be possible to
identify the transition of bottom material (e.g.: where an area of mud
meets an area of gravel).
257
Summary of Contents for LIGHTHOUSE 4
Page 2: ......
Page 4: ......
Page 20: ...APPENDIX C HARDWARE AND SOFTWARE COMPATIBILITY 478 APPENDIX D DOCUMENT CHANGE HISTORY 480 20...
Page 414: ...414...
Page 451: ...4 Select Delete again to confirm 5 Select OK YachtSense ecosystem 451...
Page 484: ......
Page 503: ......


