R&S RTE Series, Getting Started
The R&S RTE Series user manual is essential for getting started with this advanced product. Easily download the manual for free from our website to help you navigate all the features and functions of this innovative device. Enjoy a seamless user experience with the R&S RTE Series.
Share
Download


Reviews:
No comments
Related manuals for RTE Series

ACS880 Series
Brand: ABB Pages: 50

ACS880-01 Series
Brand: ABB Pages: 17

ACS880 Series
Brand: ABB Pages: 36

Tetrix 351 AC/DC Smart FW
Brand: EWM Pages: 117

Quattro
Brand: Haigh Pages: 60
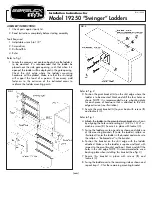
19250
Brand: Garelick Pages: 2
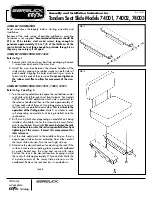
74002
Brand: Garelick Pages: 2

60064
Brand: Gardigo Pages: 32

Olympus
Brand: Patiova Pages: 19

JHC-200X
Brand: Jet Pages: 12

ThermoTweez Handpiece TT-65
Brand: Pace Pages: 14

GA500 series
Brand: YASKAWA Pages: 81

Varispeed f7
Brand: YASKAWA Pages: 52

Voluson E8
Brand: GE Pages: 37

FLOOReco 5164-040120
Brand: DOTLUX Pages: 10

COBAelite ESD
Brand: Coba Pages: 2

BOKASHI
Brand: BIOLAN Pages: 16

HEATMAX RHW-1
Brand: Hatco Pages: 24


