Chapter 7: DXi4701 Status
Performance
Quantum DXi4701 User’s Guide
179
• Select the port to monitor in the
Fibre Channel
drop-down box, or
select
Avg
to display an average of all ports.
• The horizontal axis displays time (0–100 seconds).
• The vertical axis displays data throughput (0–500 MB/s).
• Values that exceed the maximum value of the vertical axis are
shown in lighter green.
• Each bar on the graph represents approximately 1 second of time.
• Hold the cursor over a bar to display the value of the bar.
CPU
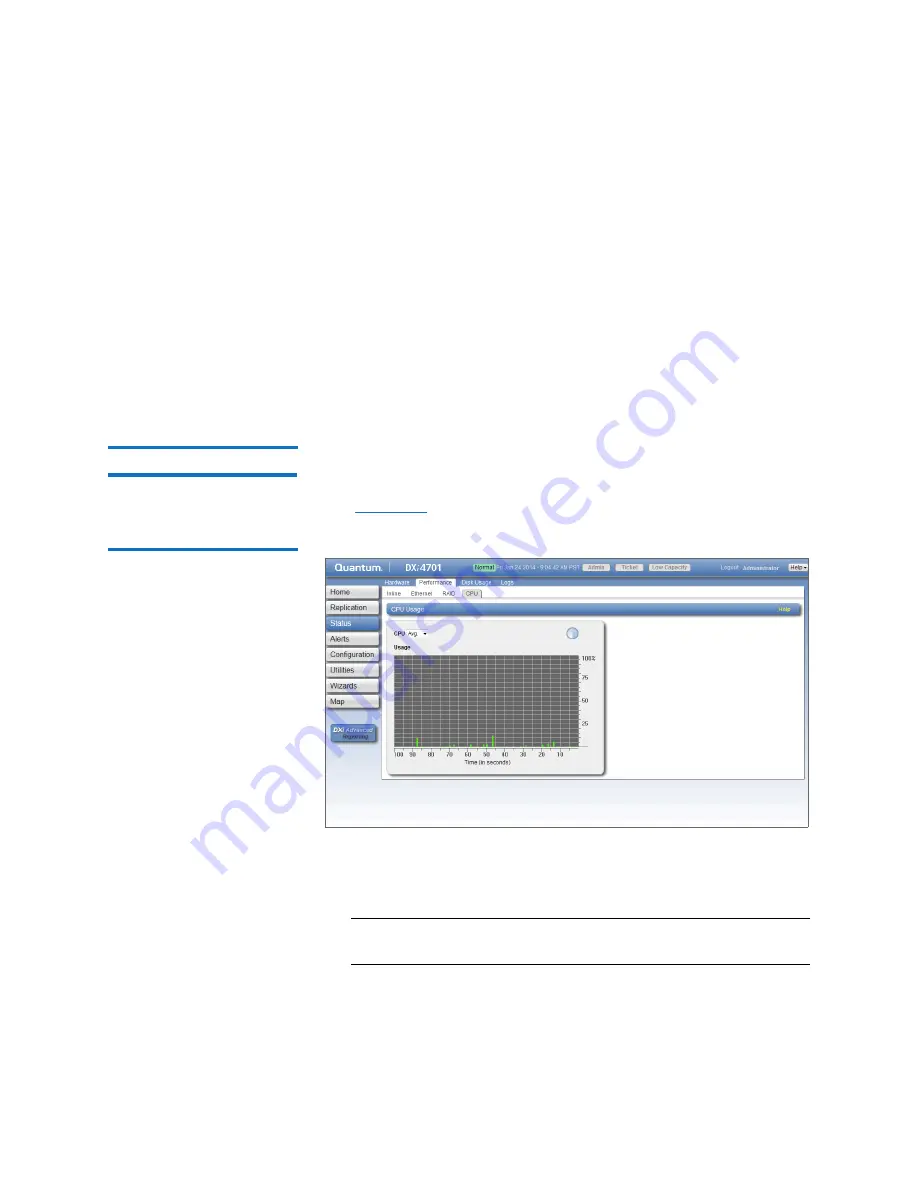
The
CPU
page allows you to view CPU usage.
To access the CPU page, on the
Performance
page, click the
CPU
tab
(see
Figure 100 CPU Page
Use the
CPU
page to display recent CPU usage in a dynamic graph:
• Select the CPU core to monitor in the
CPU
drop-down box, or select
Avg
to display an average of all CPUs.
Note:
The
CPU
drop-down box lists all CPU threads. Each hyper-
threaded CPU core counts as two threads.
Summary of Contents for DXi4701
Page 1: ...User s Guide Quantum DXi4701 with DXi 2 3 4 Software 6 68106 01 Rev C...
Page 126: ...Chapter 4 DXi4701 Configuration Wizards Support Wizard 100 Quantum DXi4701 User s Guide...
Page 138: ...Chapter 5 DXi4701 Home Page Current Activity Overview 112 Quantum DXi4701 User s Guide...
Page 384: ...Chapter 9 DXi4701 Configuration Contacts 358 Quantum DXi4701 User s Guide...
Page 418: ...Chapter 10 DXi4701 Utilities Reboot Shutdown 392 Quantum DXi4701 User s Guide...
Page 436: ...Appendix B Troubleshooting Common Problems and Solutions 410 Quantum DXi4701 User s Guide...


