®
N o n - c o n t a c t T e m p e r a t u r e S e n s o r
P S - 2 1 9 7
3
0 1 2 - 1 0 3 2 3 C
The sensor measures
V
and
T
a
internally. A
microprocessor in the sensor uses these values to
calculate
T
o
.
Object Emissivity
The sensor calculates temperature based on the
assumption that the object has an emissivity of 1. This is
a good approximation for surfaces, such as paint, wood,
paper, plastic, water, ice, human skin, and asphalt, that
have emissivities greater than 0.9.
Other surfaces, especially polished metals, have lower
emmisivites. An object with emissivity significantly less 1
will radiate less power per unit area than a blackbody of
the same temperature. A low-emissivity object will also
reflect more radiation from other sources. These
combined effects may cause the temperature reported by
the sensor to differ from the actual object temperature for
low-emissivity objects. If you know the values of
T
a
and
o
, you can approximate actual temperature using
T
o
4
=
T
R
4
o
+
T
a
4
(1-1
o
)
Where
T
R
is the object temperature as reported by the
sensor, and
T
o
is the actual object temperature. The
detector temperature,
T
a
, can be assumed equal to
ambient temperature.
A more practical way to measure the temperature of a
low-emissivity object is to apply paint or tape to the
surface, creating a surface that has the same
temperature as the object but a higher emissivity.
Measurement Accuracy
The table below gives the sensor’s accuracy for a
blackbody object over a range of sensor temperature
(
T
a
) and object temperature (
T
o
). Under typical
conditions, the accuracy is ±0.5 °C.
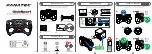
Demonstrations
•
Measure the temperatures of your hand, face,
clothes, and the inside of your mouth (Figure 1.3).
•
Measure the temperatures of various outdoor
ground surfaces (Figure 1.4).
•
Place the sensor horizontally on a table and start
recording data. Display the data on a temperature
versus time graph. Walk quickly past the sensor
•
Take a block of ice directly from a freezer and
record the temperature as it warms and melts.
Display the data on a temperature versus time
graph (Figure 1.6).
Figure 1.3: Various body parts
±4 °C
±4 °C
±3 °C
±3 °C
±3 °C
±2 °C
±2 °C
±2 °C
±1 °C
±1 °C
±1 °C
±0.5 °C
T
a
(°C)
-20
0
50
T
o
(°C)
240
180
120
60
0
-40
-70
380