Suggested Activities
Sample Data
Acceleration measurements can be used to help students better understand
velocity changes that occur with and without changes in altitude.
•
Amusement park rides:
Use the 3-Axis Acceleration Altimeter to help
students see clear, visual clues about where they experience various
acceleration changes on a ride, such as a roller coaster.
•
Skydiving:
Use the 3-Axis Acceleration Altimeter to measure changes in
altitude during the acceleration and terminal velocity portions of the jump.
•
Snow skiing:
Measure accelerations experienced from turning snow skiis
and the changes in altitude experienced throughout a ski run.
•
Ball toss:
Place the sensor inside a foam ball and toss through the air. The
resultant acceleration and altitude data can be used to determine that
acceleration is constant throughout the flight, even at the highest point.
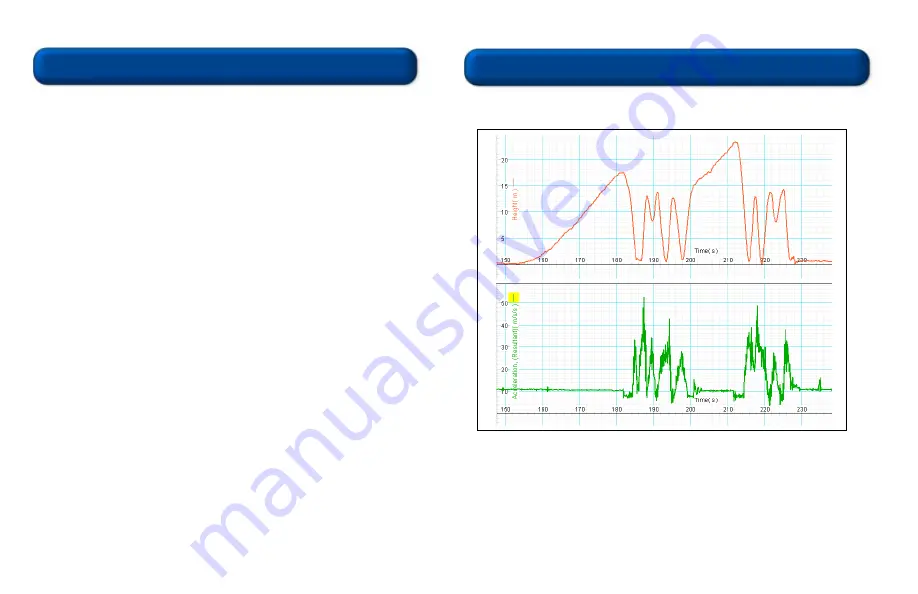
The data below was collected from an amusement park ride.
Note:
The resultant acceleration and altitude data can be placed in the same
graph window. This allows students to determine at which point on the ride
they experienced a particular acceleration. Acceleration data in the x, y, and z
axes is also available and can be displayed separately for further analysis.
CARD 2B
Height (meters)
Acceleration (resultant) (m/s/s)
Note:
Altitude data is based on measurements from a pressure sensor. The
calculation for altitude assumes standard pressure at sea level as a
reference. If your ambient pressure conditions differ from reference, the
absolute altitude reading may be incorrect or even negative. However, the
changes in altitude will be accurate within one meter.


