®
E K G S e n s o r
PS- 2111
2
012-08007G
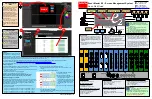
Connecting the EKG Sensor to a Person
1. Rub the skin where the
electrode patches will be
applied with a paper towel
to remove dead skin and
oil.
2. Apply adhesive electrode
patches to the right wrist,
right forearm just below
the elbow, and left
forearm just below the
elbow (Figure 1.1). Press
the patches firmly for best
adhesion and signal
quality.
3. Clip the EKG leads to the electrode patches: black
to the right wrist, green to the right forearm, and
red to the left forearm.
4. Arrange the leads so that they hang loosely without
straining the patches.
Collecting Data
1. Press or click the ‘Record’ or ‘Start’ button to begin
recording data.
2. Have subject remain still during data collection.
About the Measurements
The sensor makes two measurements: Heart Rate in
beats per minute (BPM) and Voltage in millivolts (mV).
These measurements are recorded and displayed by the
computing device connected to the sensor.
Heart rate and voltage measurements are acquired at the
default rate of 200 samples per second. You can lower
the sample rate to 50 samples per second; however for
best results, use the default rate.
About the Electrocardiogram
Figure 1.2
To see the electrocardiogram (Figure 1.2), display
voltage versus time in a graph. One part of a typical
electrocardiogram is a ‘flat line’ or trace indicating no
detectable electrical activity. This line is called the
isoelectric line. Deviation from the isoelectric line
indicates electrical activity of the heart muscles. The
sensor’s Voltage measurement represents this deviation.
The first deviation from the isoelectric line in a typical
EKG is an upward pulse followed by a return to the
isoelectric line. This is called the P wave. This wave is
caused by the depolarization of the atria and is
associated with the contraction of the atria.
After a return to the isoelectric line there is a short delay
while the heart’s atrioventricular (AV) node depolarizes
and sends a signal along the atrioventricular bundle of
conducting fibers (the bundle of his) to the Purkinje
fibers, which bring depolarization to all parts of the
ventricles almost simultaneously.
After the AV node depolarizes there is a downward pulse
called the Q wave. Shortly after the Q wave there is a
rapid upswing of the line called the R wave followed by a
strong downswing of the line called the S wave and then
a return to the isoelectric line. These three waves
together are called the QRS complex. This complex is
caused by the depolarization of the ventricles and is
associated the with the contraction of the ventricles.
After a short period the sodium and calcium ions that
have been involved in the contraction migrate back to
their original location in a process that involves
potassium ions and the sodium-potassium pump. The
movement of these ions generates an upward wave that
then returns to the isoelectric line. This upward pulse is
called the T wave and indicates repolarization of the
ventricles.
The sequence from P wave to T wave represents one
heart cycle. The number of such cycles in a minute is
right
red
left
green
black
Figure 1.1
T wave
P wave
QRS complex