P-Sea Software Co.
PO Box 1390
Morro Bay, CA 93442 USA
Ph (805) 772-4396 FAX (805) 772-5253
P-Sea Fish Finder
The sounder module/option will have:
)
640 pixel by 30 color resolution
)
1000/600 watts output
)
Speed and Temperature to .01 degrees
)
Ethernet data transfer
)
Multiple PC connection and data transfer to simplify
hookup; use one GPS, one depth sounder black box and
one transducer to feed data to up to 3 computers. Data is
transferred from PC to PC via the Ethernet cable.
)
Bottom Classification; Hardness, Roughness and
Biomass
)
Review of past sounder picture; jumps to position on
plotter as you scroll sounder history
)
Several hour graphs of; Depth, temp., biomass, hardness
and roughness. Click on graph to jump to that location on
plotter screen.
)
FishFinder marks show on plotter & give snapshot of
Fishfinder screen when mouse arrow placed on it.
)
All the standard features of high-end sounders such as
auto range, auto gain, auto shift, variable pulse length,
multiple background colors, bottom alarm, fish alarm,
temp alarm, high/low power settings, bottom lock, zoom,
mix mode that combines both 50 & 200 khz together, and
bottom expansion
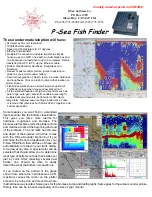
Some features you won't find in a standard
depth sounder like the bottom classification.
This gives you three more alarms for
hardness, roughness and biomass. The
biomass alarms also alerts the plotter portion
and creates a mark at the beginning and end
of the biomass. The end mark has the size
and depth of the biomass. All of this comes
with the P-Sea Sounder Option but if you
purchase the Bottom Classification for your
P-Sea WindPlot II then all three of these are
automatically recorded in your track history
for review at any time. A special color can be
selected that should allow you to determine
what type of bottom your past track was over
just by color. After collecting several past
tracks, one should be able to easily
determine what the bottom composition is.
If you clicked on the portion of the graph
shown here where the hardness was at it's
maximum causes the cursor on the plotter
screen to be turned on and moved to where
that hardness was located. Same goes for the biomass, temp and depth graphs. Same goes for the actual sounder picture.
History time can be in hours depending on the size of your monitor.
Greatly reduced price on CVB20A!


