icListen User Guide
21
v2021.1
Data Page
This page has two subsections which allow viewing of data in real time, and data management
and retreival.
Data - Spectrum Charts
Two charts are displayed on this page. The top one continuously displays power levels at each
frequency while the lower is a standard waterfall display showing power levels by frequency
over time. Recording status, FFT recording bandwidth and processing method are also displayed.
The reference level, step size, and time represented by the width of the window can be modified,
individual images can be saved, and the display stopped/restarted.
Data can also be streamed using Lucy or PAMGuard with the icListen PAMGuard Plug-in
installed. See the
PAMGuard plug-in Quick Start Guide
details.
Data - Retreive
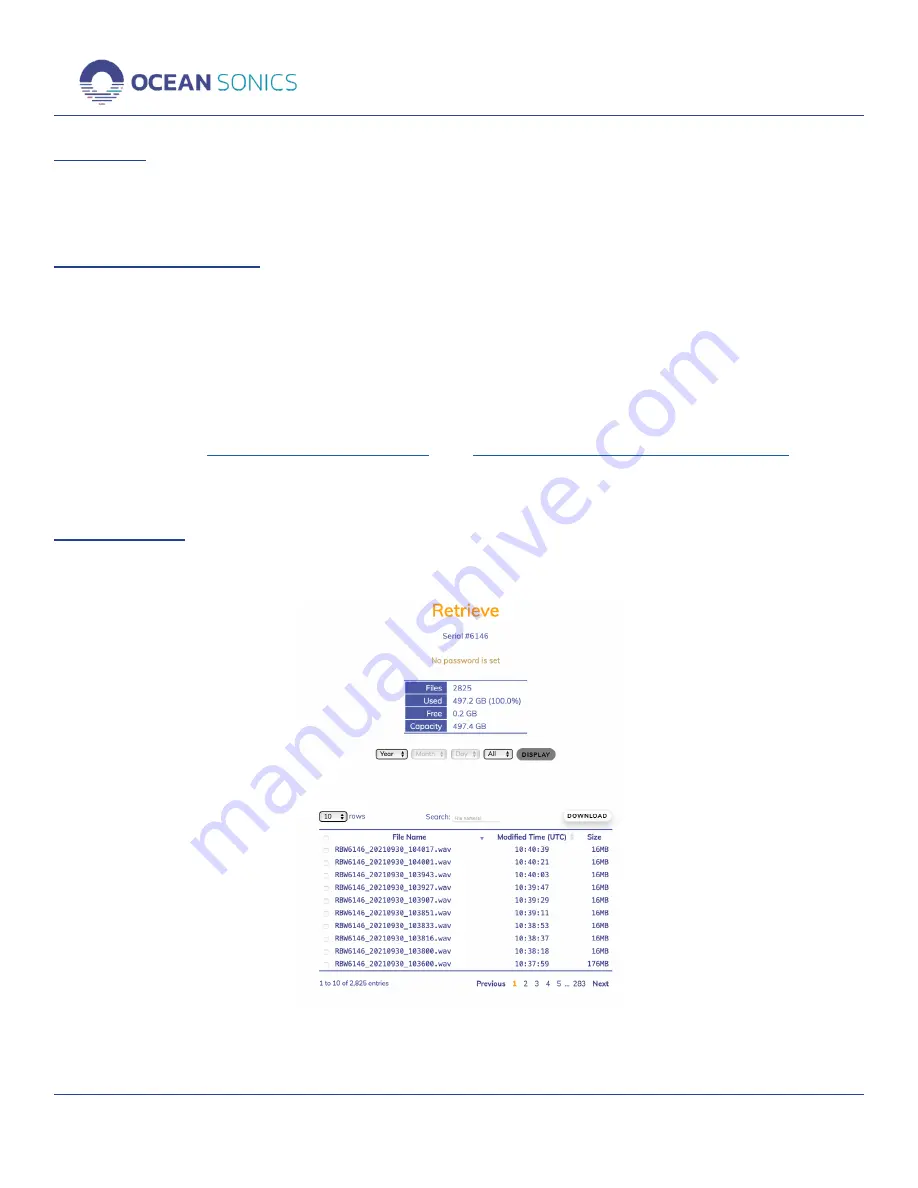
This page provides memory usage status, and the ability to search, sort, and download files.
All files recorded on the icListen are listed and can be filtered by date and type, or searched by
name.
Summary of Contents for icListen
Page 45: ...icListen User Guide 42 v2021 1...


