


Navigation of Charts
The Kestrel 4000 is capable of storing up to 250 data points. To review
the data, press the
button while viewing a chart. A cursor will appear
on the most recent data point. Press the button to scroll through
older data points and the button to scroll through more recent data
points. The date and time at which the data was stored will be displayed
at the bottom of the screen. The data value will be displayed at the top of the screen. Hold down the or
button to scroll quickly through the data points.
Press the
or
button to review the data for the other measurements. Please note that the cursor will
remain at the same date and time. If new data is stored while viewing chart data, the entire chart will shift left
with the new data point charted on the right. The cursor will not shift with the chart.
Press the
button to return to the Chart Mode.
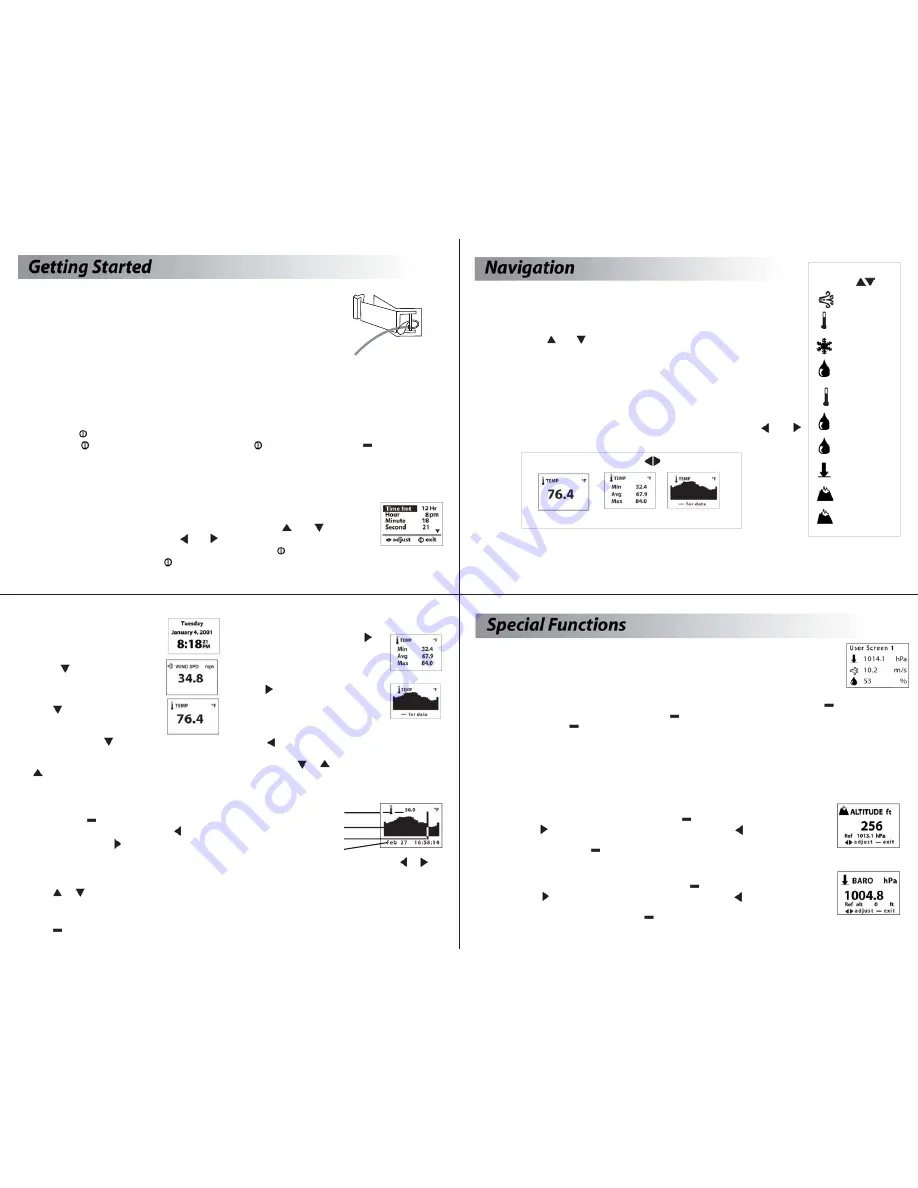
Mode Navigation
While in a Current Screen, press the
button to view the Min/Max/Avg for a
measurement. If there is no stored
data, the values will be displayed as --.-
Press the button again to view a
chart for the measurement. If there is
no stored data, the axis will appear, but
the chart will be blank.
Press the button to return to the Min/Max/Avg and
Current Screens. From either Min/Max/Avg or Chart
Screen, press the
or
button to scroll through the
Min/Max/Avg or Chart Screen for the other
measurements.
Measurement Navigation
Starting on the Date & Time Screen…
…Press the
button to scroll to the
Current Wind Speed Screen.
Press the
button again to scroll to
the Current Temperature Screen.
Continue pressing the
button to scroll through
the Current Measurement Screens, listed on the
previous page, followed by the 3 User Screens. Press
the
button to scroll through these screens in
reverse order.
7
Value
Chart
Cursor
Date & Time
In addition to these Measurements and Modes, there are also 3 User Screens, which simultaneously
show 3 current measurements (see pages 8 and 10 for more information); and the Date & Time Screen,
which gives the current date and time.
6
The Kestrel 4000 is set up to display
10 Measurements
(some are actually
calculations) in
3 Modes.
The
Measurements
are listed to the right with their corresponding screen
icon. Using the
and
buttons will scroll through the various
Measurements.
The
Modes
are:
Current
- displays the instantaneous reading
Min/Max/Avg
- displays the Minimum/Maximum/Average readings from
stored data
Chart -
displays a graphical representation of up to 250 stored data points.
Examples of each of these screens are shown below. Using the and
buttons will scroll through the various Modes.
Modes
use
Current Min/Max/Avg Chart
Measurements
use
Wind Speed
Temperature
Wind Chill
Humidity
Heat Index
Dew Point
Wet Bulb
Altitude
Density
Altitude
HI
DP
WB
Barometric
Pressure
D
Pouch and Lanyards
A soft pouch and wrist and neck lanyards have been provided. To install
the lanyard, feed the thin end of the lanyard around the metal post on
the battery door (as shown in diagram). Feed the thick end of the lanyard
through the loop on the thin end.
Battery Installation
Use only AAA batteries. Install batteries as indicated on the battery door. After installing the
batteries, the Kestrel 4000 will automatically start in the Date and Time Setting mode. (See Date and
Time Setup below.) Custom settings and chart data will be saved during a battery change.
Turning the Kestrel 4000 ON and OFF
ON:
Press the
button.
OFF:
Hold the
button for two seconds. Or, press the
button, then press the
button with the
word OFF highlighted. (Note: your unit will continue to automatically store data when the power is
turned off.)
Date and Time Setup
The first time that you turn on your Kestrel 4000, as well as after a battery change,
you will need to set the date and time. The Introduction Screen will appear for 3
seconds, followed by the Date/Time Setup Screen. Press the
and
buttons to
scroll through the settings. Press the and buttons to scroll through the
setting options. After entering the date and time, press the
button to exit the
Date/Time Setup. Then press the
button again to exit the Main Setup Menu.
5
8
User Screens
The Kestrel 4000 has three User Screens which can be customized to display three current
measurements simultaneously. (See page 10 for setup instructions.)
Min/Max/Avg for Wind Speed and Wind Chill
The Min/Max/Avg values for Wind Speed and Wind Chill are measured independently from the stored and charted
data. While viewing the Min/Max/Avg screen for either Wind Speed or Wind Chill, press the
button to begin
collecting data for both measurements. Press the
button again to stop collecting data and hold the values
on the display. Press the
button a third time to clear the data. This routine will work simultaneously for both
measurements, regardless of which one is displayed while the routine is run. The Min/Max/Avg for Wind Speed
and Wind Chill will not affect any other Min/Max/Avg or stored data.
Barometric Pressure and Altitude Adjustment
The Kestrel 4000 will measure air pressure in order to calculate barometric pressure and altitude. Changes in
either air pressure or altitude will affect these readings, so it's important to make adjustments as necessary.
Altitude Adjustment
Obtain a barometric pressure reading from a local weather source to use as your reference
pressure. From the Current Altitude Screen, press the
button to enter the adjustment
mode. Press the button to increase the reference pressure or the button to decrease
the reference pressure. You will notice that the Altitude will change with changes in the
reference pressure. Press the
button to exit the adjustment mode.
Pressure Adjustment
Obtain your altitude from a topographical map or landmark to use as your reference altitude.
From the Current Barometric Pressure Screen, press the
button to enter the adjustment
mode. Press the button to increase the reference altitude or the button to decrease
the reference altitude. You will notice that the Barometric Pressure will change with
changes in the reference altitude. Press the
button to exit the adjustment mode.