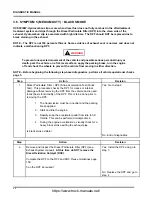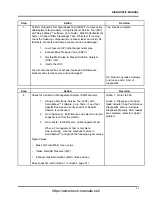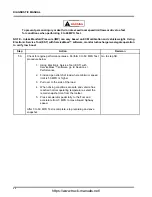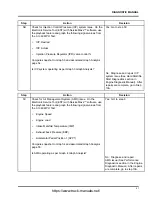
DIAGNOSTIC MANUAL
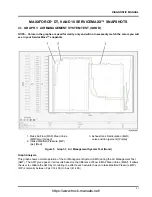
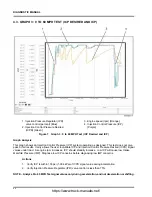
4.3. GRAPH 3: 0 TO 60 MPH TEST (ICP DESIRED AND ICP)
1. Injection Pressure Regulator (IPR)
valve control (percent) [Blue]
2. Injection Control Pressure Desired
(ICPD) [Green]
3. Engine speed (rpm) [Orange]
4. Injection Control Pressure (ICP)
[Purple]
Figure 7
Graph 3: 0 to 60 MPH Test (ICP Desired and ICP)
Graph Analysis
This graph shows an Injection Control Pressure (ICP) system operating as designed. This test does not give
pass or fail results. It only allows the user to validate ICP and Injection Control Pressure Desired (ICPD) signal
values under load. As engine rpm increases, ICP should steadily increase. Low ICP will cause low Intake
Manifold Pressure (IMP). Diagnose low ICP concerns before diagnosing low IMP concerns.
Actions
1.
Verify ICP is within 150 psi (1,034 kPa) of ICPD signal value during acceleration.
2.
Verify Injection Pressure Regulator (IPR) valve control is less than 75%.
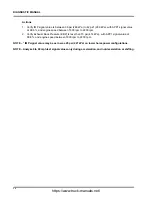
NOTE – Analyze 0 to 60 MPH Test signal values only during acceleration, and not deceleration or shifting.
54
https://www.truck-manuals.net/

