Applicable to: B22 and B25 (a ll versions)
Revision 1.3 – 02/24/ 2015
Manual B – Operations
-
25
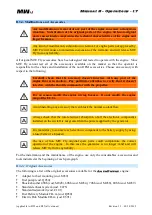
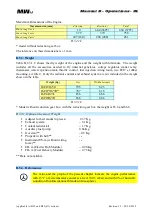
B22 Version
Powe r [HP (kW)]
B
22D
B
22H*
B
22L
B
22R
Take off (max for 5 minutes)
@rpm
95 (69.8)
@3400
131.5 (96.7)
@4300
114.7 (84.3)
@3950
130.3 (95.8)
@4550
max continuous
@rpm
82 (60.3)
@3320÷3400
112.5 (82.7)
@4300
98 (72)
@4010÷4200
110 (80.9)
@4420÷4700
Smaller specific consumption
@MAP[inHg]
64 (47.1)
@24
92.5 (68)
@25.6
84.5 (62.1)
@25.6
96.5 (70.9)
@25.7
B.5.4.1.C
* Data refers to the engine model without reduction gear box
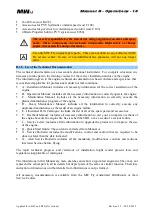
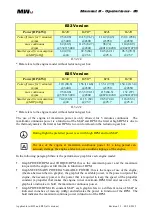
B25 Version
Powe r [HP (kW)]
B
25D
B
25H*
B
25L
B
25R
Take off (max for 5 minutes)
@rpm
110 (80.8)
@3400
156 (114.6)
@4300
133.1 (97.9)
@3950
154.2 (113.4)
@4550
max continuous
@rpm
95 (69.8)
@3330÷3400
133.5 (98.1)
@4300
115 (84.5)
@4070÷4200
132 (97)
@4500÷4700
Smaller specific consumption
@MAP[inHg]
74.2 (54.5)
@24
111.5 (82)
@25.7
98.5 (72.4)
@25.7
116 (85.3)
@25..8
B.5.4.2.C
* Data refers to the engine model without reduction gear box
The use of the engine at maximum power is only allowed for 5 minutes continuous. The
maximum continuous power is a function of the MAP and RPM: the limit at high RPM is due to
the thermodynamics; the limit at low RPM is to avoid overload on the reduction gear box.
During flight the preferred power is set with high RPM and low MAP.
The use of the engine at maximum continuous power for a long period can
seriously damage the engine and can cause a sudden stoppage of the engine.
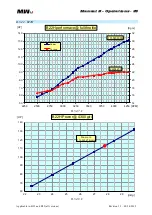
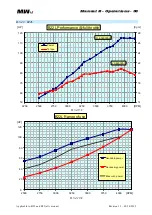
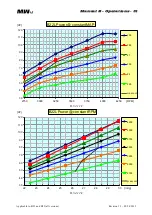
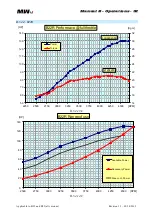
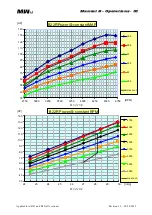
In the following paragraph there is the performance graph for each engine model:
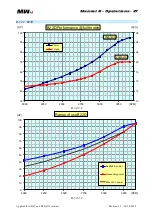
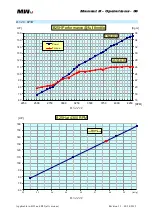
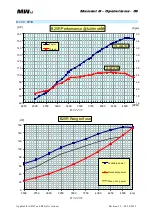
Graph POWER/RPM and TORQUE/RPM: this is the maximum power and the maximum
torque with the engine at full throttle in function of RPM.
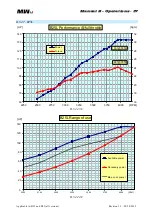
Graph NECESSARY POWER/AVAILABLE POWER: this is the range of use of the engine,
(the area between the two graphs), the graph of the available power, is the power output of the
engine, the necessary power is the power that is required to keep the speed of the propeller
constant (a propeller that makes the engine run at maximum RPM limit and not over). The
graph also indicates, in bold, the maximum continuous power.
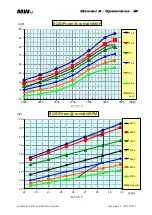
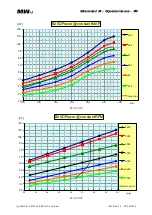
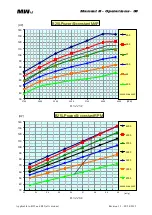
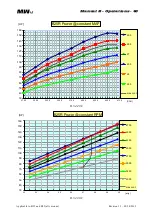
Graph POWER/RPM with constant MAP: each graph refers to a different value of MAP as
indicated in inches of mercury (inHg) and indicates the power in function of the RPM. The
bold indicates the maximum continue power in function of the RPM.


