© Munters AB, 2019
32
2. In the Graph Name field, type the graph name.
3. From the Category drop down list, select a category.
4. From the Graph Type drop down list, select the graph type.
5. In the Description text box, add any required text.
6. Select the graph properties:
o
Point labels: Date
o
Legend:
o
Point Markers
o
Horizontal/Vertical Lines: Set up a grid
7. Choose background color.
8. Click Save.
The new graph appears.
6.2.3.3
Editing a Graph
The Edit function enables changing the graph appearance.
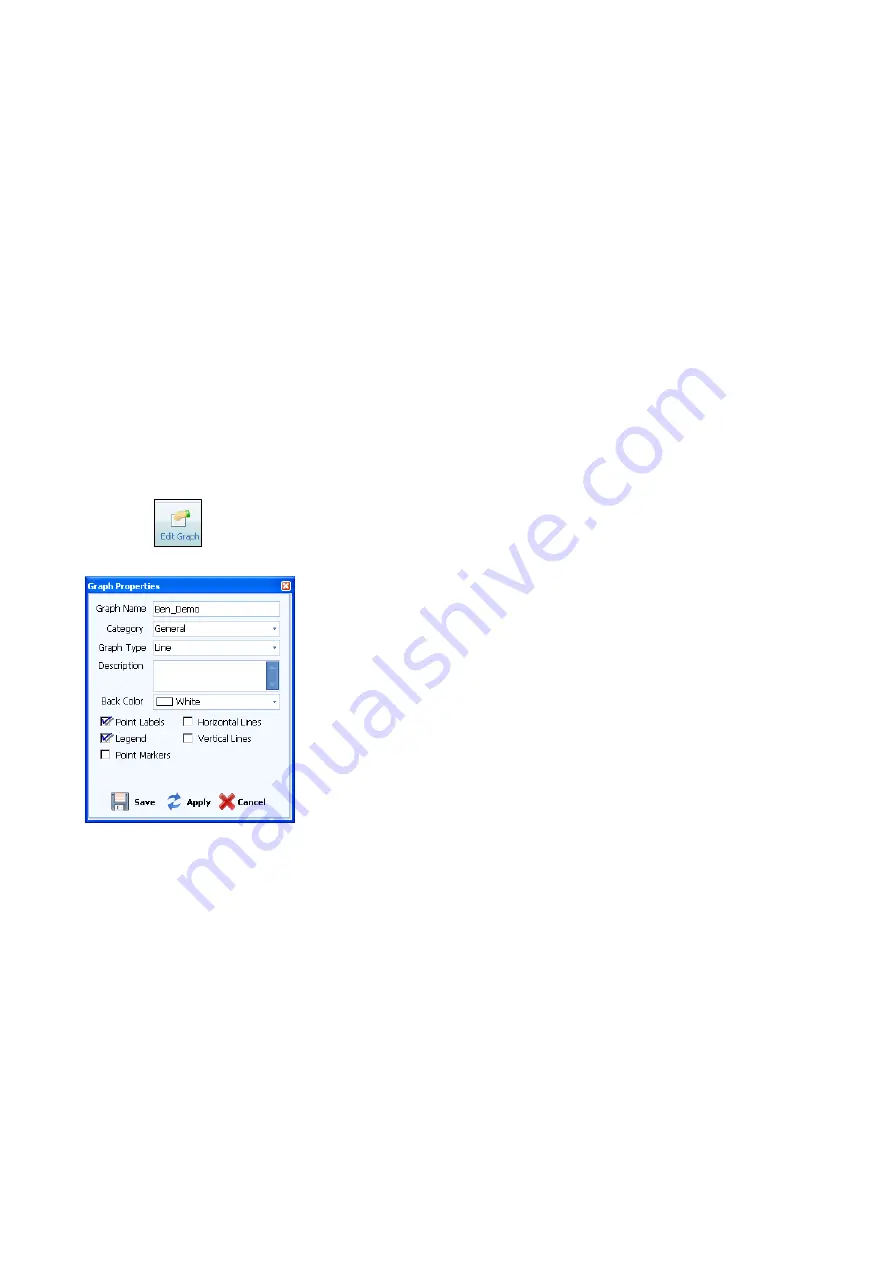
1. Click .
The Graph Properties window opens.
Figure 33: Edit Graph Properties Window
2. Edit the fields as required.
3. In the Description text box, add any required description.
4. Choose background color.
5. The check boxes determine what details appear on the graph. Click the required boxes.
6. Click Save.
The graph displays the new settings.
6.2.3.4
Sensor Settings in GreenNet
•
•


