


measurements are taken at regular time intervals, from the same points and under
the same conditions.
To deliver the service staff on site a report about the periodic changes in vibration
severity and consequently the previous history of the measurement point concerned,
the VM24 provides a graphical trend display. The prerequisite for retrieving graph-
ical trends is placing the sensor on the relevant VMID. The trend display is obtained
by pressing the F1 key (24).
The trend display only takes values from the data memory into account which be-
long to the VMID operation mode currently active. If the VMID operation mode is
changed (cf. Chapter 6.3.3), the previously saved data with a different operation
mode will not be shown in the trend display.
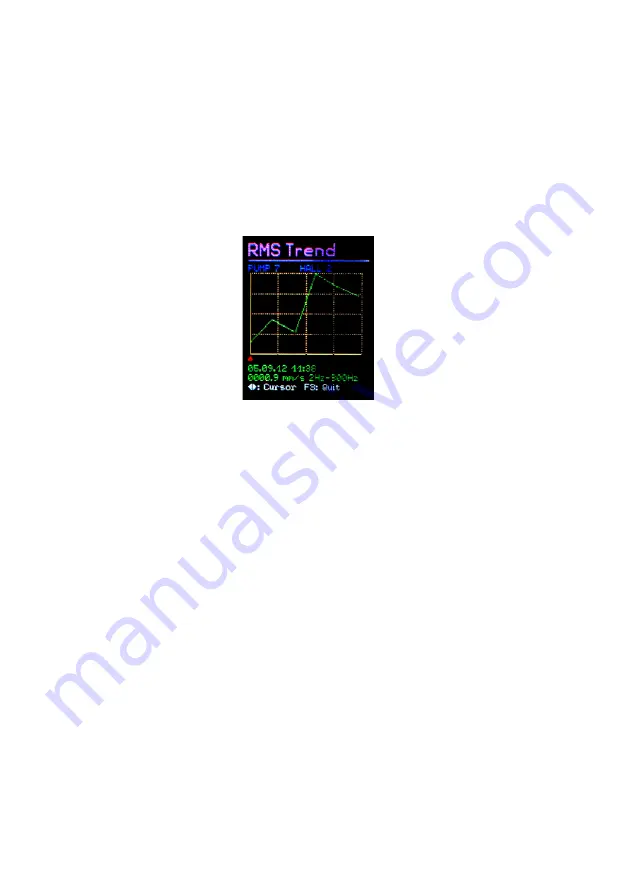
The vertical axis indicates the RMS of the vibration quantity and the horizontal axis
indicates time. Both are scaled to their respective maximum value. The time axis
shows the interval between the first and last saved measurement. Below the diagram
there is a red marker. This can be moved horizontally to read the magnitude, using
the◄► keys. The marker only skips forward to time points which already have a
measurand. At each data point the date and time of the measurement as well as the
measured RMS are displayed. Above the diagram the text assigned to the measure-
ment point is displayed. In order to be able to display trends, the points are joined
together by a line.
Press F3 to exit the trend display.
If only one or zero measurands for a selected measurement point can be located in
the memory, the error message “Too few data for trending” will appear instead of
the trend graphic.
Note: The available PC software enables you to view the trends more conveniently,
even without it being connected to the measuring point .
6.6. Viewing Saved Measurement Values
In addition to the graphical trend readings for current measurement points, saved
measurement data can be viewed in text format. Open the main menu by pressing
F3, then select the sub-menu option 'Measurement Data Memory'. From within the
sub-menu select 'View measurement Data'. The measurement data can be viewed in
order of the VMID serial number or the date it was saved. Select your preferred
menu option using keys ▼▲ and press OK to confirm. The first data record will
now be displayed. At the top, a consecutive number and the number of the data
record within the memory will also be shown. Below these, the measuring point se-
rial number and its assigned text are also displayed.
18
Figure 24: Trend display


