background image


2)


Launch the MIP Soft & Hard Iron Calibration software. 

 
3)


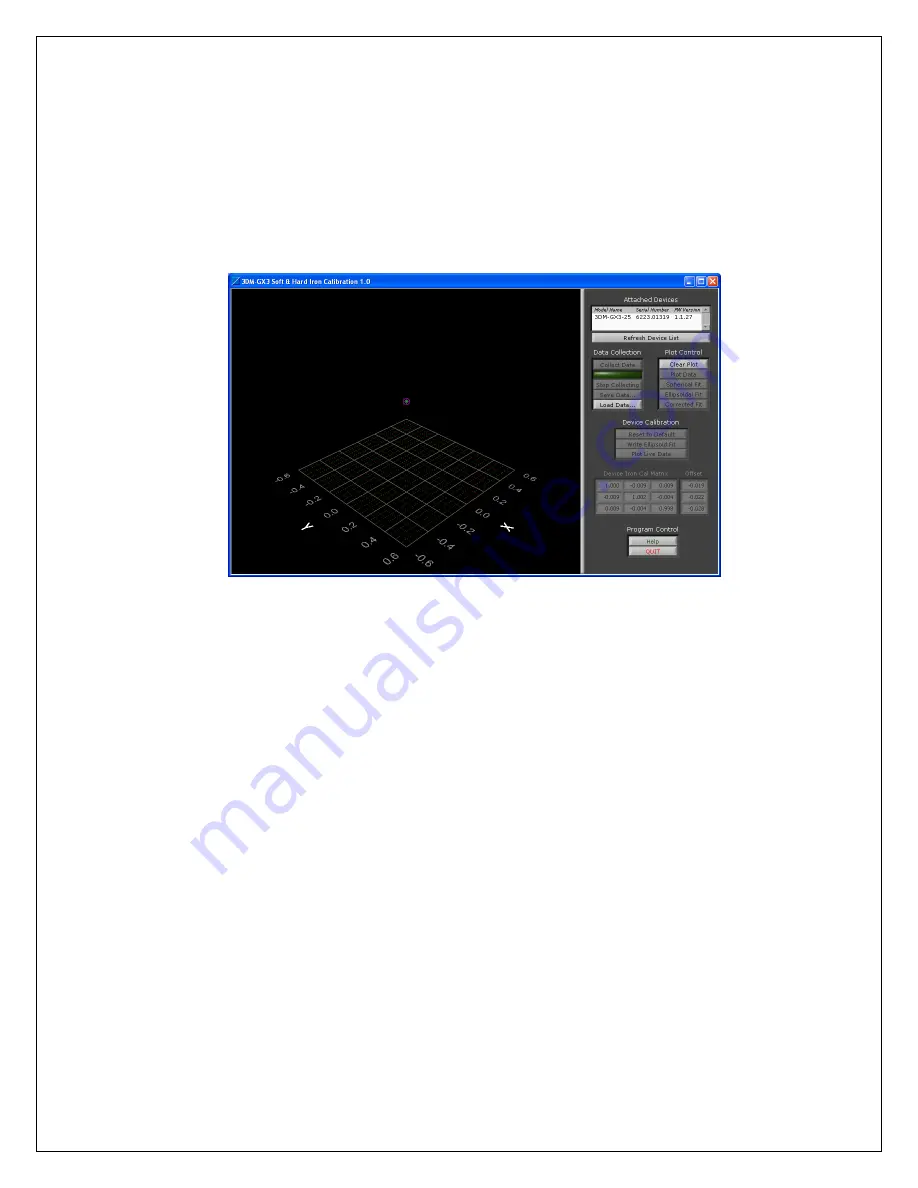
The MIP Soft & Hard Iron Calibration Main window will appear.  If you have a 3DM-
GX3

®

 connected, it will appear in the Attached Devices list as shown in 

Figure 1

.   If you 

add a device after the application has been launched, you must click the Refresh Device 
List button for the new device to appear.   


.


Figure 1


4)


Select the device to calibrate.  This enables several of the controls in the screen.  
Collecting data is very easy; just follow this basic sequence of calibration steps: 

a.


Click Collect Data to start collecting data. 

b.


Move the device in all possible orientations to collect data.  As you move the 
device, points will appear on the display in 3D. 

c.


Click Stop Collecting. 

d.


Click Spherical Fit and/or Ellipsoid Fit to show the calculated calibration result. 

e.


Click Corrected Fit to show how the corrected data will look. 
 

5)


You may repeat this sequence as many times as you wish until you are happy with the 
result.  Click Write Spherical/Ellipsoid Fit to write the calibration to the device.  The 
actual calibration values written to the device will be displayed in the Device Iron Cal 
Matrix and Offset panels. 
 

6)


After writing the calibration, you can view real time calibrated output by clicking Plot 
Live Data. 


Example 

Below is a series of screen shots (

Figures 2-7

) showing a sample sensor calibration.  The sensor 

used for this example has a steel nut taped to the housing.  As you can see from the screen shots, 
this steel nut causes a strong offset and a slight ellipsoid deformation to occur. 
 

Summary of Contents for 3DM-GX3 Series

Page 1: ...ts and bolts Often these sources are hard to avoid or are hidden and so a field calibration of the magnetometer after final installation is highly recommended This can be accomplished using MicroStrai...

Page 2: ...appear on the display in 3D c Click Stop Collecting d Click Spherical Fit and or Ellipsoid Fit to show the calculated calibration result e Click Corrected Fit to show how the corrected data will look...

Page 3: ...resenting the center of the data sphere is offset from the circle which represents the center of the sensor Normally these should be superimposed Figure 3 Spherical Fit The sphere fits pretty well but...

Page 4: ...ure 4 Ellipsoidal Fit The ellipsoid fit captures many of the points that were not on the surface of the spherical fit Figure 5 Corrected Fit The green sphere shows what the calibrated data should look...

Page 5: ...en points represent data taken after the calibration is written to the device Notice the values in the Device Iron Cal Matrix and Offset Figure 7 Live Data and Corrected Fit This shows how the correct...

Page 6: ...f your application Mounting changes or changes in surroundings may make a difference in the magnetometer output and by using this application you can see the magnetic effects and correct for them as n...

Page 7: ...use permanent damage to its components Many GPS antennas have a magnetic base the antenna we provide does not If you substitute a GPS antenna and its base is magnetic please keep it away from the 3DM...

Reviews: