Page 23
Operation
colorCONTROL MFA-7/-14/-21/-28
5.4.3
Data Acquisition Table
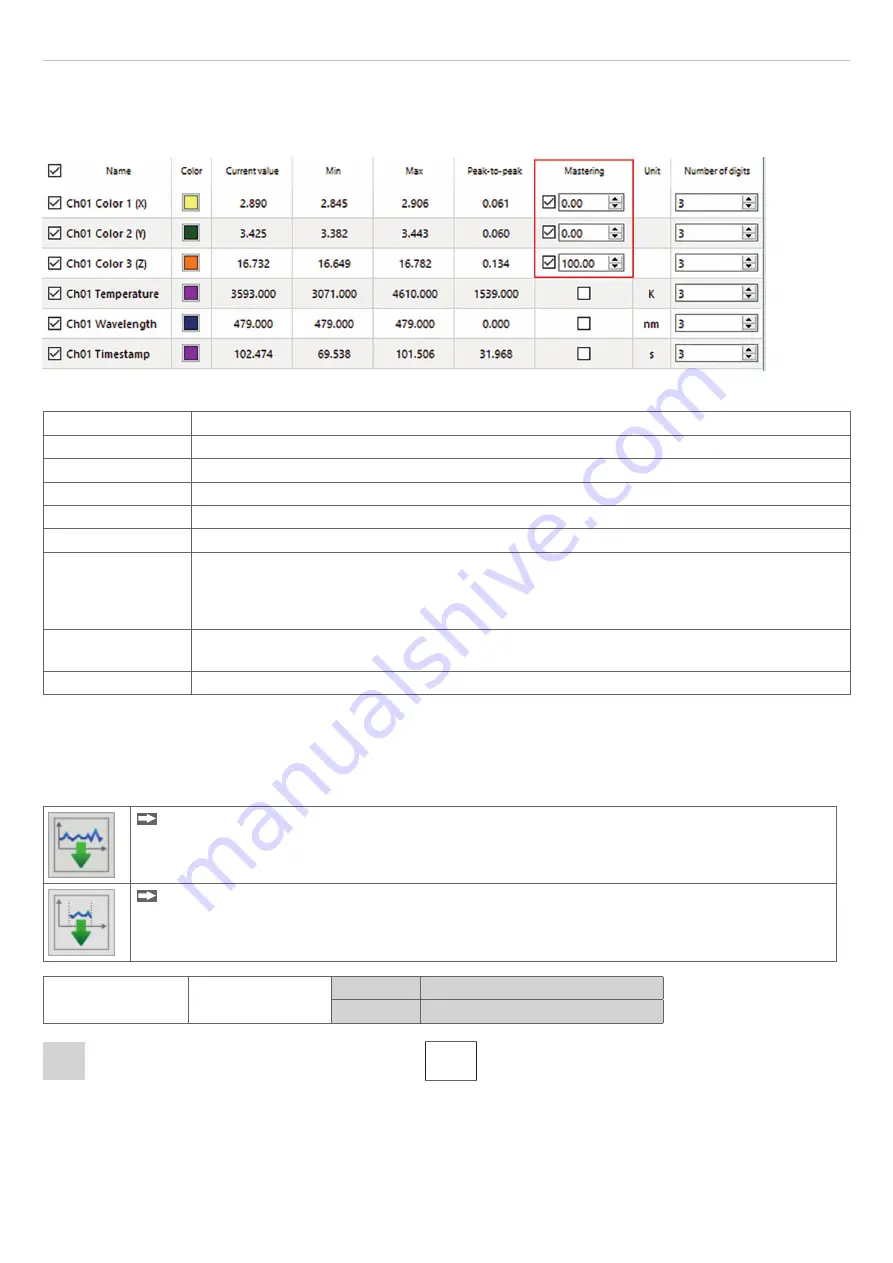
Here you can select the measurement data to be displayed in the time graph as well as the number of decimal places for
said data.
Fig. 10 Detail from table
Name
Here you can show and hide signal curves for the channels.
Color
Here you can change the color settings for the individual curves.
Current value
Displays current measured value.
Min
Minimum of determined measured value.
Max
Maximum of determined measured value.
Peak-to-peak
Difference between min. and max.
Mastering
By activating the
Mastering
the master value can be manually entered.
The master values are set using
Master now
in the
Master
tab in the
Measurement >
Signal Processing
menu
Select a sensible value within the range of -1000 to
+1000.
Unit
Selection of the output to be displayed. The outputs are set beforehand in the Settings menu
under Output / Output range and adjustment.
Decimal places
0 - 12
Fig. 11 Data acquisition table
5.4.4
Recording and Saving Measurement Data
During data acquisition, the measurement data is only displayed and not automatically saved on the PC. However, in the
CSV output, you can start transmitting data into a *.CSV file or save just the current visible region of the time graph.
Click on this button to start recording measurement data.
Click on this button to save the current measurement value selection.
Data acquisition
CSV output
Format
Point / comma
Separator
Comma / semicolon / tab
Fields with gray background require a selection.
Value
Fields with dark border require entry of a
value.


