OptiCal User’s Manual
Michell Instruments
27
APPLICATION SOFTWARE
Clicking on the
Run
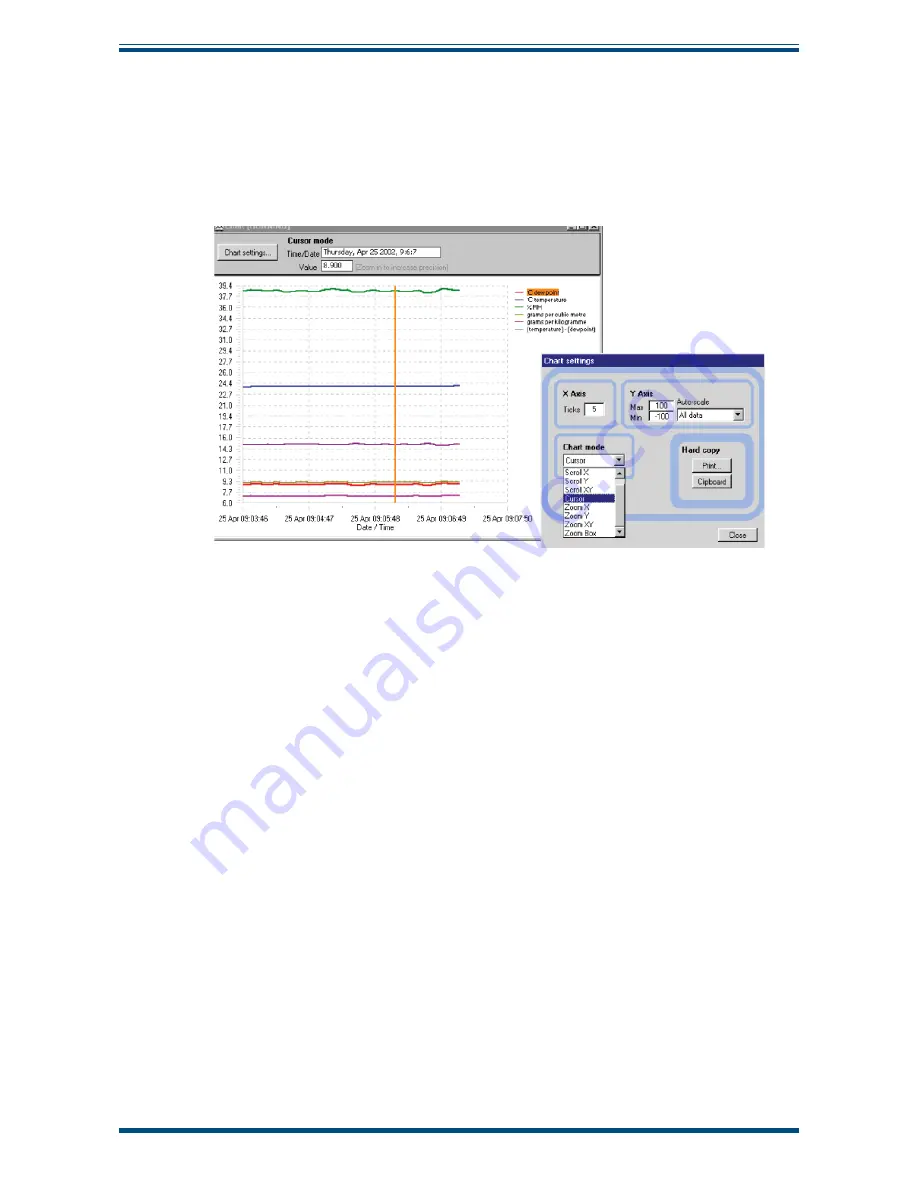
button will bring up the chart as shown below. The chart shows
the measured and calculated humidity values selected in the
Chart
section, with an
assigned identi
fi
able color for each value. It is possible to scale, zoom and scroll both X
and Y axis of the chart by using the controls in the
Chart Settings
window, which can
be activated by clicking on the
Chart Settings
button.
Figure 23
Chart Window
The X & Y axes can be individually scaled. The X-axis can be scaled by using the
ZoomX
feature in the
Chart mode
section, while the Y-axis can be scaled by changing the min
and max values, or selecting a parameter in the
Auto-scale
list, which scales the Y-axis
to the actual values of the parameter.
There are a number of modes associated with the chart, which can be selected from
the
Chart mode
list; Plot, Scroll (X, Y, & XY), Cursor, Zoom (X, Y, & XY) and Zoom Box.
In order to use the scrolling and zooming modes, make your selection and click the left
mouse button on the chart itself, moving the mouse across the chart accordingly with
the left mouse button held down. This will zoom or scroll the chart accordingly.
Individual data points can be selected from the chart by using the cursor mode. Select
the parameter in question by clicking on a legend on the right hand side of the chart (°C
dew point is shown as selected above) and moving the cursor to the point of interest -
the actual value with its time stamp will be displayed above the chart.


