MI 2792 PowerQ4 Plus
Operating the instrument
37
Show long term flicker P
lt
Show 1 min short term flicker P
st1min
Select between trending various parameters:
Show selected flicker trends for phase 1
Show selected flicker trends for phase 2
Show selected flicker trends for phase 3
Show selected flicker trends for all phase (average only)
Switch to METER view
Switch to TREND view
Return to the “MEASUREMENTS” menu screen.
3.7 Phase Diagram
Phase diagram graphically represent fundamental voltages, currents and phase angles
of the network. This view is strongly recommended for checking instrument connection
before measurement. Note that most measurement issues arise from wrongly
connected instrument (see 4.1 for recommended measuring practice). On phase
diagram instrument shows:
Graphical
presentation
of voltage and current phase vectors of the measured
system,
Unbalance of the measured system.
3.7.1 Phase diagram
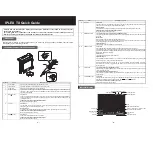
By entering PHASE DIAGRAM menu from MEASUREMENTS menu following screen is
shown
(see figure below)
.
Figure 3.27: Phase diagram screen.
Table 3.28: Instrument screen symbols and abbreviations
Current recorder status:
RECORDER is active
RECORDER is busy (retrieving data from memory)
RECORDER is not active


