8
OPERATION
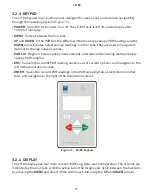
LP-80 updates and displays the current calculated
τ
, LAI,
F
b
,
χ
, and
z
values at the
bottom of the screen with each subsequent below-canopy PAR measurement.
With each above- or below-canopy measurement, a number appears to the right of the
PAR value that indicates the number of completed measurements. The displayed PAR
value reflects the sample average. In
, the LP-80 made four above and three
below-canopy measurements, so the average of the four above-canopy PAR values is
211 μmol/(m
2
s), while the average of the three below-canopy values is 20 μmol/(m
2
s).
NOTE: When connected to the external sensor, the LP-80 uses readings from the external sensor as above-
canopy PAR readings to calculate LAI. Summary data on the bottom of the screen are recalculated using the last
above-canopy reading with each subsequent below-canopy reading.
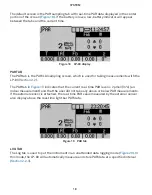
5. Press
ENTER to bring up the Save screen to save as is, annotate, or discard (
).
Press
ESC to discard the values.
Both options clear the screen for new data.
2.2.3 LOG MODE MEASUREMENTS
NOTE: LAI and
τ
are calculated more accurately by manually sampling PAR beneath a canopy at random locations
instead of leaving the LP-80 in one place and collecting data in log mode.
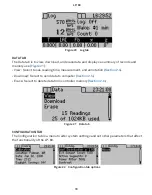
1. Navigate to the Log tab.
2. Select the measurement interval by pressing the
UP or DOWN arrows to select any value
between 1 and 60 min.
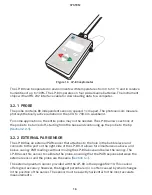
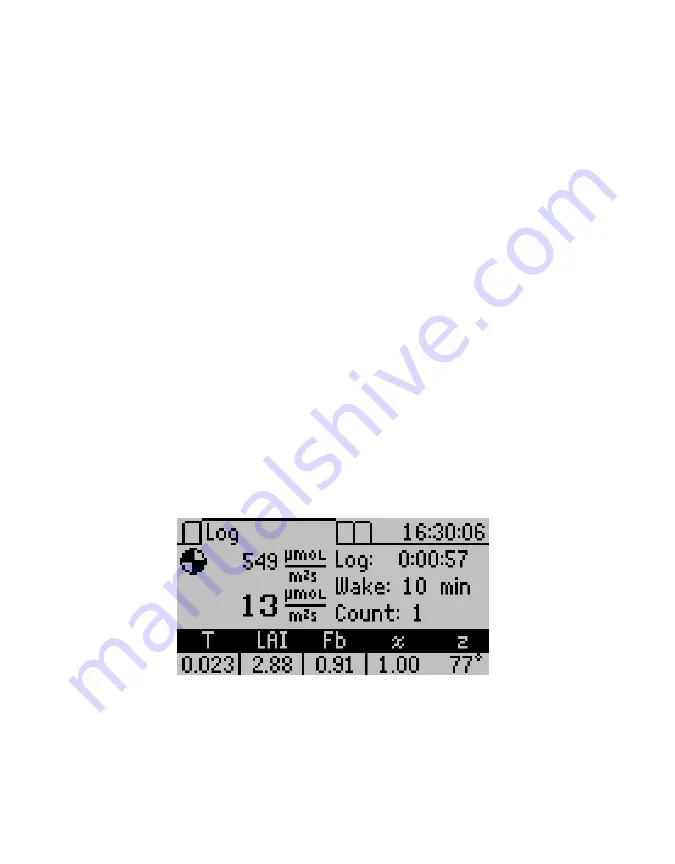
3. To activate the logging mode, press
ENTER. The screen will begin to return data
).
To cancel the logging mode, press
ESC.
NOTE: Other tabs can be viewed while the logging mode is activated.
Figure 9 Log tab with measurements set every 1 min
The LP-80 saves data taken in this mode automatically (without annotation). While
activated, the LP-80 continues to log data until logging mode is canceled.
NOTE: This mode is for short-term experiments (1 or 2 days). The LP-80 is not designed to be left in the field for
long periods of time.


