Temperature Graph
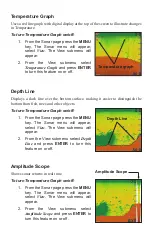
Uses a red line graph with digital display at the top of the screen to illustrate changes
in Temperature.
To turn Temperature Graph on/off:
From the Sonar page press the
1.
MENU
key. The Sonar menu will appear,
select
View
. The View submenu will
appear.
From the View submenu select
2.
Temperature Graph
and press
ENTER
to turn this feature on or off.
Depth Line
Displays a dark line over the bottom surface, making it easier to distinguish the
bottom from fish, trees and other objects.
To turn Temperature Graph on/off:
From the Sonar page press the
1.
MENU
key. The Sonar menu will appear,
select
View
. The View submenu will
appear.
From the View submenu select
2.
Depth
Line
and press
ENTER
to turn this
feature on or off.
Amplitude Scope
Shows sonar returns in real time.
To turn Temperature Graph on/off:
From the Sonar page press the
1.
MENU
key. The Sonar menu will appear,
select
View
. The View submenu will
appear.
From the View submenu select
2.
Amplitude Scope
and press
ENTER
to
turn this feature on or off.
Amplitude Scope
Temperature graph
Depth Line


