background image

A measurement example using a
twelve flask system

A twelve flask system was constructed following the
methods outlined above and used to measure CO

2

 efflux

from navel oranges. Flask air temperature was monitored
during the measurements with an 8150-203 soil tem-
perature thermistor installed in each flask as described
above. Fluxes were calculated on a fresh weight basis and
a volume correction was used to account for the flask
volume occupied by the fruit. The flux measurements
were made over a 3 minute period (observation length =
3 min). Due to significant carryover of CO

2

 from one

flask to the next (Figures 11 and 12) the first 60 seconds
of each measurement were ignored in the flux calcula-
tions (deadband = 60 sec).

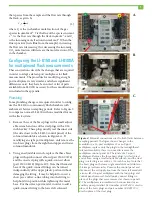
Figure 11. 

 Chamber CO

2

 mole fraction during

measurement of navel orange respiration. Data shown are
for one flask over one three minute measurement. The
initial decrease in CO

2

 mole fraction is due to mixing of the

high mole fraction air trapped in the measurement loop
from the previous measurement with the air in the flask.

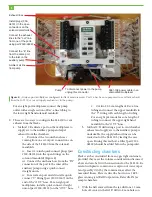
Figure 12. 

The change in CO

2

 mole fraction with time

calculated for various deadband lengths using the data
shown in Figure 13. dC/dt is calculated as the slope of a
straight line fit to the CO

2

 mole fractions. Due to carryover

of CO

2

 in the measurement loop, an appropriate estimate

of dC/dt cannot be made without excluding the first 60
seconds of data.

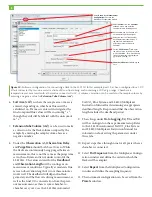
Figure 13. 

Navel orange respiration measured with a

multiplexed flask system. 

A. 

Respiration rates for ten

oranges measured over a 24 hour period. The number
given for each symbol indicates the port where the flask
was connected. 

B. 

The fluxes for port 2 (solid circles)

plotted with chamber airtemperature (open circles). 

C. 

The

fluxes shown in panel B plotted as a function of
temperature.

Flux (µmol kg

-1

 s

-1

)

Time of Day

0.5

0.45

0.4

0.35

0.3

0.25

0.2

0.15

1

1

:30

15:30

13:30

17:30

19:30

23:30

21:30

1:30

3:30

7:30

9:30

5:30

9:30

Flux (µmol kg

-1

 s

-1

)

Chamber T

emp. 

(°C)

Time of Day

Flux (µmol kg

-1

 s

-1

)

Chamber Temp. (°C)

A.

B.

C.

Chamber CO

2

 concentration

 (µmol mol

-1

)

Time (seconds)

Deadband length (seconds)

dC/dt (µmol mol

-1

 s

-1

)

9

Summary of Contents for LI-8100A

Page 1: ...early in half because the increased volume serves to dilute the change in CO2 mole fraction within the system As dC dt decreases the potential for error in the measurement due to instrument noise incr...

Page 2: ...s the mechanism by which CO2 and water vapor are exported from the system between measurements preventing condensation and excessively high CO2 mole fractions from developing in the flask The flushing...

Page 3: ...o brass plugs from the right hand upper and lower solenoid manifolds 2 Using an adjustable wrench replace the three brass plugs with quick connect elbows part 300 07474 and the one steel plug with a q...

Page 4: ...for flask measurements bottom right The flow path used during measurements is shown with blue arrows and the flow path used to flush flasks between measurements is shown with red arrows In both diagra...

Page 5: ...ver plate from the instrument by loosening the two thumb screws Figure 7A Mount the pump in the LI 8150 case by attaching the mounting plate to one of the two threaded holes normally used to attach th...

Page 6: ...thod 2 If dedicating a port to vent chamber exhaust and supply air to the auxiliary pump is undesirable the supply exhaust lines can be routed out of the LI 8150 by leaving the case open If using this...

Page 7: ...ments are made at near ambient tempera tures a measurement of chamber air temperature may not be required Figure 9 Mason jar lid fitted with plumbing connections and a soil temperature thermistor Two...

Page 8: ...as measured with a thermistor connected to V2 A volume correction can be made for the sample volume by entering a negative value for Extension Tube Volume cm3 Soil CO2 Flux System and LI 8150 Multiple...

Page 9: ...on air trapped in the measurement loop from the previous measurement with the air in the flask Figure 12 The change in CO2 mole fraction with time calculated for various deadband lengths using the dat...

Page 10: ...lated soil samples Jones and Kielland 2002 Haney et al 2008 and monitoring carbon fluxes from attached leaves and fruit Araki et al 1998 Kitano et al 1997 References Araki T M Kitano M Hamakoga and H...

Page 11: ...8100A 8150 770 01 8150 661 8150 203 8150 670 16 or 8150 670 8 196 10534 210 01958 1 9981 173 9981 177 9881 204 140 04315 8150 250 300 07124 300 07125 300 07126 300 07127 167 07256 300 08118 300 07474...

Page 12: ...licor com envsupport UK licor com LI COR Biosciences Global Headquarters 4647 Superior Street Lincoln Nebraska 68504 Phone 1 402 467 3576 Toll free 800 447 3576 Fax 1 402 467 2819 envsales licor com...

Reviews: