


Operating
25
Oper
ating
2
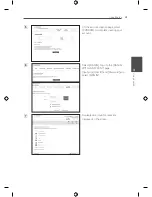
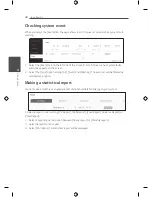
ESS information menu
Energy Analysis
On [Energy Analysis], you can check the statistical information of this system.
You can review the amount of energy generated, consumed, sold and purchased on this system.
The statistical data of the day, week, month and year are supported.
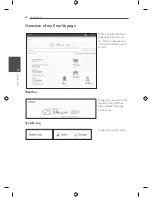
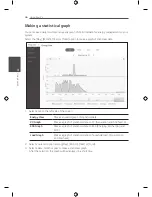
PV Graph
Analyzes the energy generated and sold from PV within selected period and displays as a graph.
Select [PV Graph] on [Energy Analysis].
Generated energy is marked with green and sold
energy is marked with purple on the line graph.
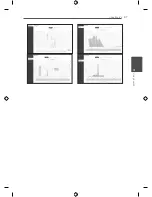
You can change the period by tapping [Day],
[Week], [Month] and [Year].
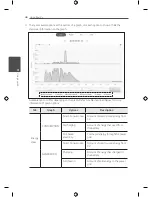
A
: Goes to previous [Day], [Week], [Month] or
[Year].
D
: Goes to next [Day], [Week], [Month] or
[Year].
Summary of Contents for D005KD1N111
Page 37: ...Using EnerVu 37 Using EnerVu 3 ...
Page 52: ......
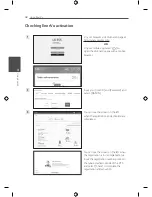
Page 56: ...4 Accept terms Check Select All and select AGREE ...
Page 65: ......
Page 66: ......
Page 67: ......
Page 68: ......


