AD122-96 MX
Appendix IV
20
Appendix IV: Viewing Noise Floor on AD122-96 MX Display
The simplest form of random noise is "white noise". White noise is bounded between two limits. The
probability of occurrence for any amplitude value between the two limits (boundaries) is equal; thus, it
is also named uniform distribution noise. Analog noise is not white. It is mostly "Gaussian", with
higher probability of occurrence for smaller amplitudes. The large amplitudes occur less frequently and
the distribution follows the familiar "bell shaped curve".
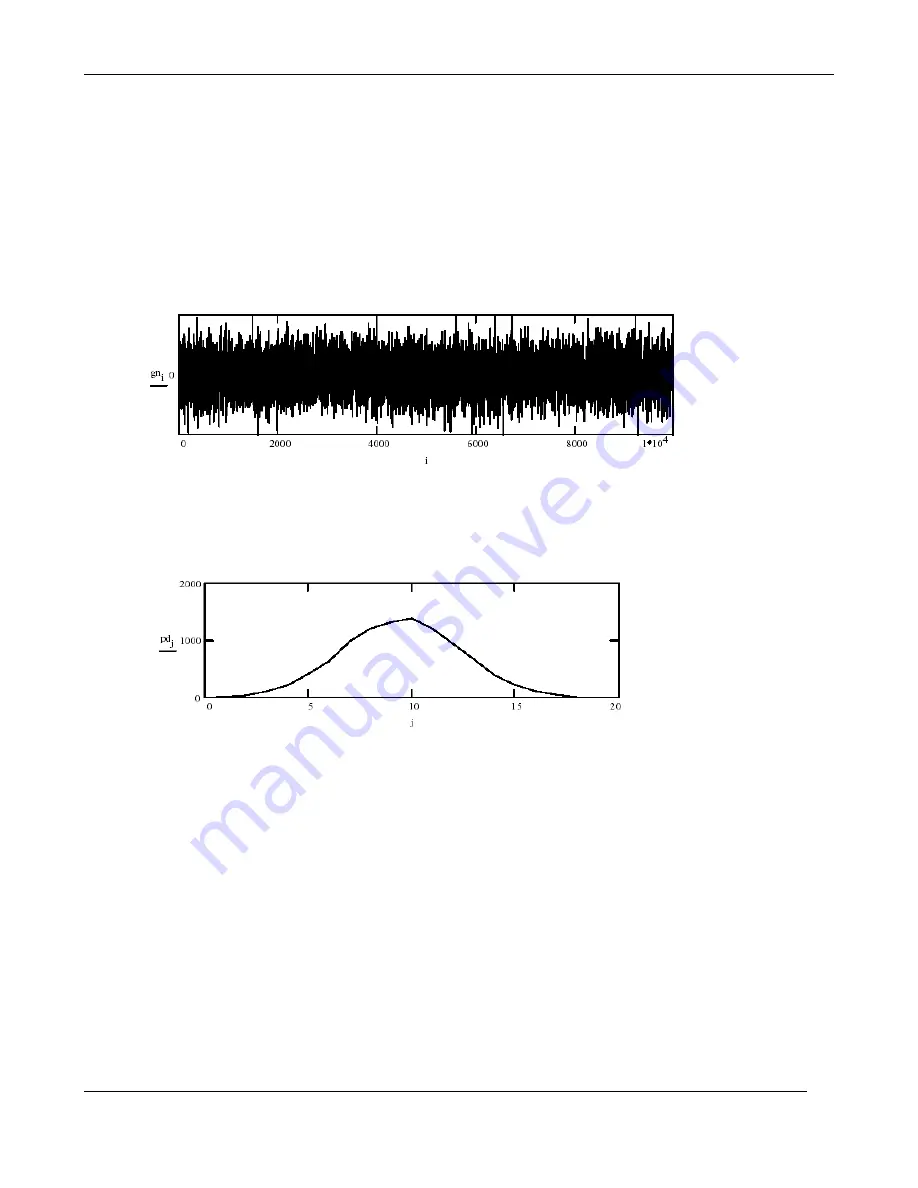
Let us plot an "oscilloscope picture" sample of 10000 points of a Gaussian sequence:
To view the Gaussian data in its more familiar bell-shaped form, we use the following construction,
computing a histogram by grouping the values in 20 bins of width .05:
Computing the mean and standard deviation yields close to perfect results (mean and stdev):
= mean( ) gn 0.001 = stdev( ) gn 1.001
Gaussian noise energy is measurable via a rms. (root mean square) meter. The proper measurement of
converter noise should be done using a rms. instrument (such as Lavry Engineering’s Model 3000,
Audio Precision test system or others). However, the known bell shaped curve coupled with a peak
reading offers a reasonable and quick estimate of the rms. value:
Step 1: Provide a low resistance path (0 to 500 Ohms) between pin 2 and pin three of the analog input
connector(s).
Step 2: Set the DC FILTER ON (remove the DC offset to overcome its effects on the Bar-graph
display)
Step 3: At the Display Control Screen, set to "METER: -90".
Step 4: Read the peak value on the LED Bar graph.
Step 5: The noise floor is at about 8dB below the reading
Example: The reading of peak is at -24dB. Subtracting 90dB yields -114dB of peak hold values.
Subtracting 8 yields -114 - 8 = -122dB of noise floor.


