


8
Embedded Artists LPC4357 Guide
16 October 2013
Memory
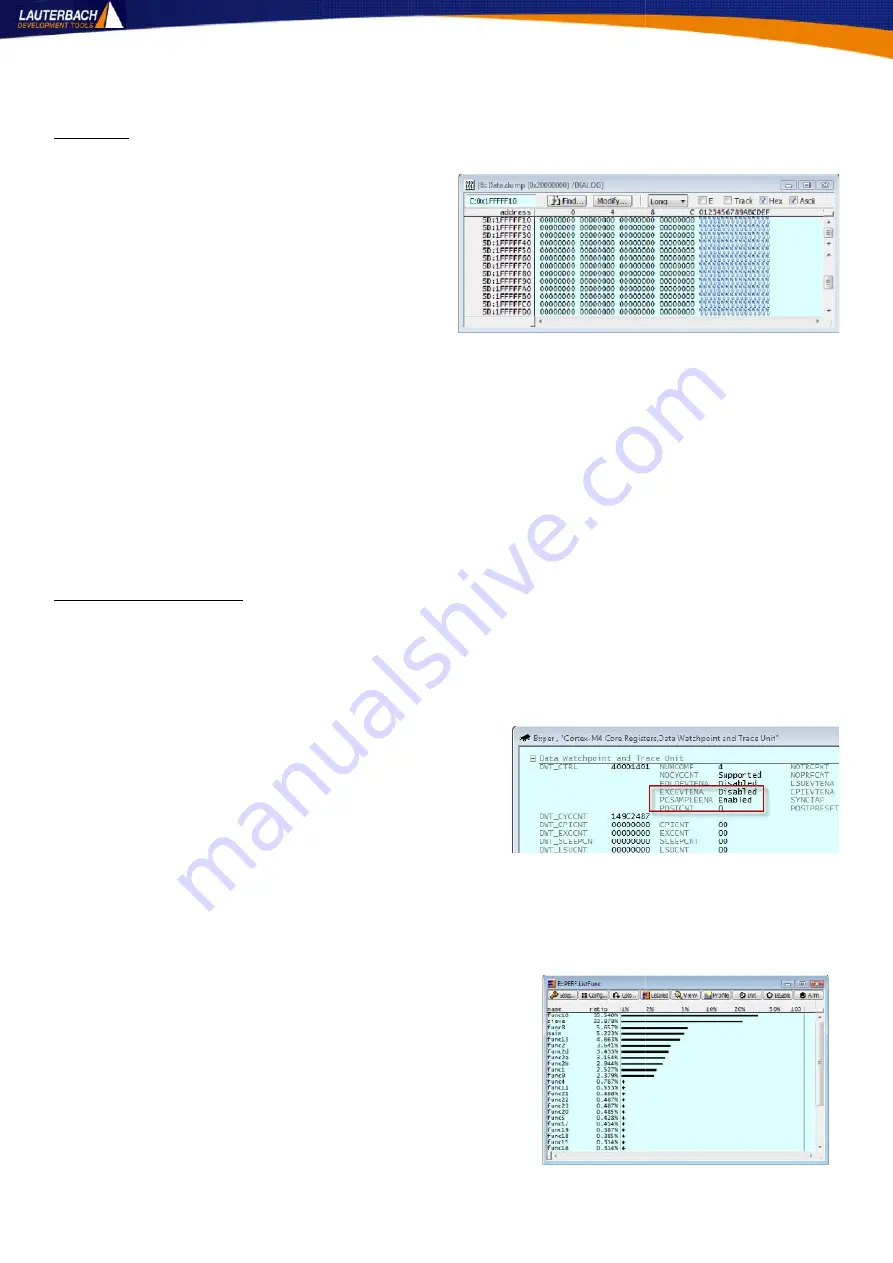
Memory can be viewed by selecting Dump... from the View menu. Enter the
address to view and set any relevant options. A
window will be displayed like figure T7. Memory
can be searched for a pattern. Memory can be filled
with a pattern or a test pattern. Two ranges can be
compared or a CRC can be calculated for a given
range. A walking bit test can also be performed
over a memory region.
All memory view windows can have the
/SPOTLIGHT
option added to them allowing the highlight of any changes in contents. Each value has a
right-click menu behind it providing access to further options.
Try the following:
var.view flags /SPOTLIGHT
data.dump flags /dialog /SPOTLIGHT
Change the values in one window and the values in the other will be highlighted.
Performance Analysis
A sample based performance analysis capability is provided. This can be accessed by selecting
Perf
Configuration...
from the
Perf
menu. An entire book could be written on this window alone so
instead a few examples will be provided to get you started.
This is a sample based metric and may or may not be intrusive depending upon the core chosen. If the
DWT in the chosen core supports the PC Snoop mode, the
sampling will be made non-intrusively. This can be checked
by opening the
Data Watchpoint and Trace
setting from the Peripheral Registers view and checking
the availability of PCSAMPLEENA. See Figure T8. PC Snoop
is available on all Cortex-M4 cores, all Cortex-M0+ cores,
and all Cortex-M3 cores of r2p0 or newer.
If this is available non-intrusive metrics can be collected. Set the METHOD in the Perf window to
Snoop
.
If not, the target will need to be halted to read the Program Counter for the samples. Set the METHOD in
the Perf window to
StopAndGo
.
To view relative function runtime analysis:
Set the METHOD as described above
Set the Mode to PC
Set the state to OFF
Click the ListFunc button
Start the target running
An example is shown in figure T9.
Figure T7: Memory Dump
Figure T8: PC Snoop
Figure T9: PC Snoop
8
Embedded Artists LPC4357 Guide
16 October 2013
Memory
Memory can be viewed by selecting Dump... from the View menu. Enter the
address to view and set any relevant options. A
window will be displayed like figure T7. Memory
can be searched for a pattern. Memory can be filled
with a pattern or a test pattern. Two ranges can be
compared or a CRC can be calculated for a given
range. A walking bit test can also be performed
over a memory region.
All memory view windows can have the
/SPOTLIGHT
option added to them allowing the highlight of any changes in contents. Each value has a
right-click menu behind it providing access to further options.
Try the following:
var.view flags /SPOTLIGHT
data.dump flags /dialog /SPOTLIGHT
Change the values in one window and the values in the other will be highlighted.
Performance Analysis
A sample based performance analysis capability is provided. This can be accessed by selecting
Perf
Configuration...
from the
Perf
menu. An entire book could be written on this window alone so
instead a few examples will be provided to get you started.
This is a sample based metric and may or may not be intrusive depending upon the core chosen. If the
DWT in the chosen core supports the PC Snoop mode, the
sampling will be made non-intrusively. This can be checked
by opening the
Data Watchpoint and Trace
setting from the Peripheral Registers view and checking
the availability of PCSAMPLEENA. See Figure T8. PC Snoop
is available on all Cortex-M4 cores, all Cortex-M0+ cores,
and all Cortex-M3 cores of r2p0 or newer.
If this is available non-intrusive metrics can be collected. Set the METHOD in the Perf window to
Snoop
.
If not, the target will need to be halted to read the Program Counter for the samples. Set the METHOD in
the Perf window to
StopAndGo
.
To view relative function runtime analysis:
Set the METHOD as described above
Set the Mode to PC
Set the state to OFF
Click the ListFunc button
Start the target running
An example is shown in figure T9.
Figure T7: Memory Dump
Figure T8: PC Snoop
Figure T9: PC Snoop


