


Analyzing 3D Scan Data - Line-by-Line Leveling
KLA-Tencor P-16+ / P-6 User’s Guide
7-34
KLA-Tencor Confidential
0142530-000 AB
3/13/09
Use Default Line Position [0% 50% 50% 100%]
7
This option can be used best when scanning a sample with uniform texture typical of
film roughness scans. This function operates best when there are known flat regions
throughout the Y axis direction. This preset option automatically levels the scan by
placing the left cursor’s left border at the origin of the scan, the left cursor’s right
border at the mid point of the scan, the right cursor’s left border also at the midpoint
of the scan, and the right cursor’s right border at the end point of the scan.
Use Defined Line Positions
7
The Defined Line Positions can be set in two ways:
The operator chooses
Use Defined Line Positions
as the leveling tool. The
operator manually enters (sets) the positions of the cursors in microns. These
settings are between 0
μ
m and the number of microns in the scan length, as
defined in the recipe.
The operator can enable line-by-line leveling and choose
Use Defined Line
Positions
as the leveling tool. The operator then either runs the scan to obtain the
data, or opens saved data that used the same recipe. The Line-by-Line procedure
is used to level the data and the data is saved. Once saved, the positions of the
newly placed cursor lines is displayed in the recipe.
Manual Entry of Line Position in Line Field
1.
Opening the 3D Cursor Parameters Window
2.
In the 3D Cursor Parameters window, ensure that
Enable Automated Line by Line
Leveling
.)
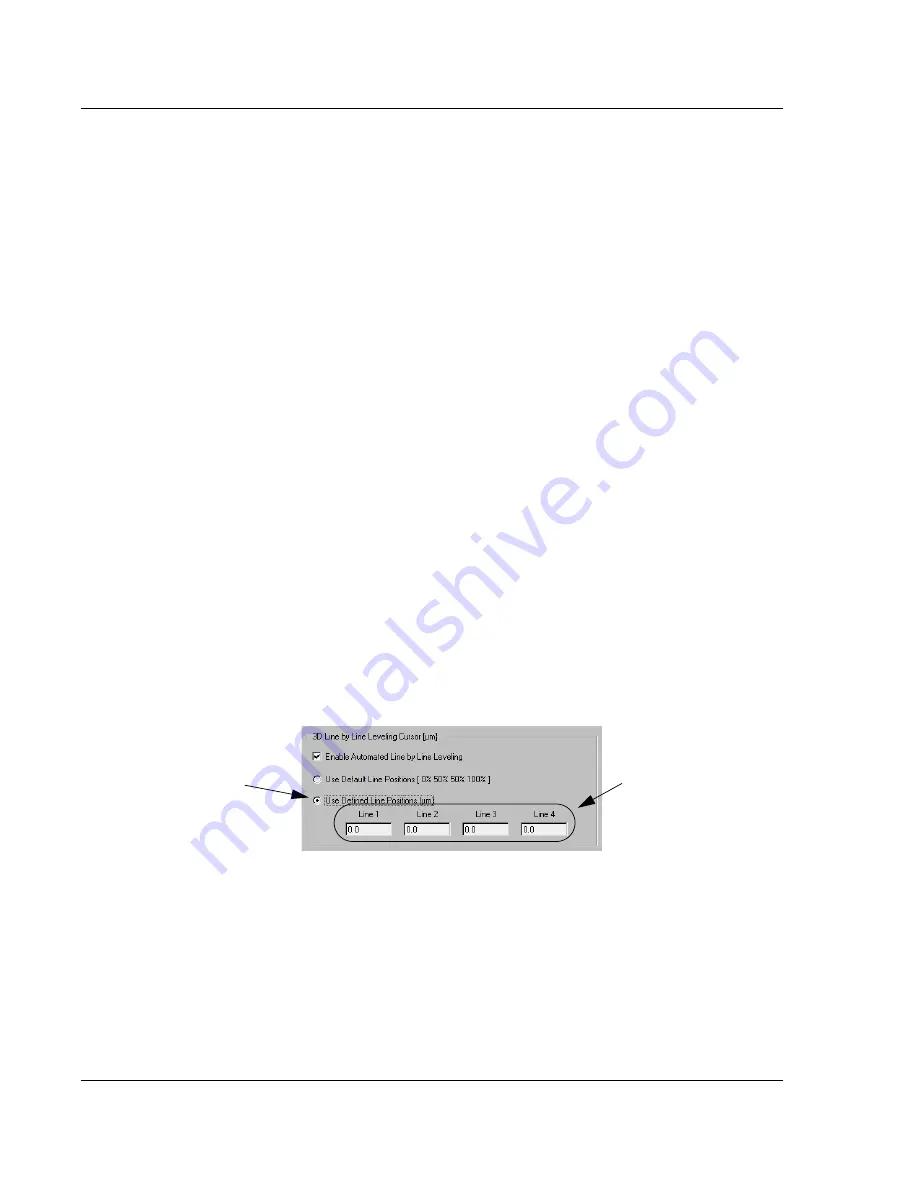
3.
Click the empty radio button next to
Use Defined Line Positions
to enable it. (See
Once
Use Defined Line Positions
is enabled, the four Line fields become active.
Figure 7.21
3D Line by Line Leveling Cursor Field
Choose
Use
Defined Line Positions
Either:
Manually enter positions in
each field.
OR
Manually position the line
cursors on the image in
Analysis screen.


