Getting Around
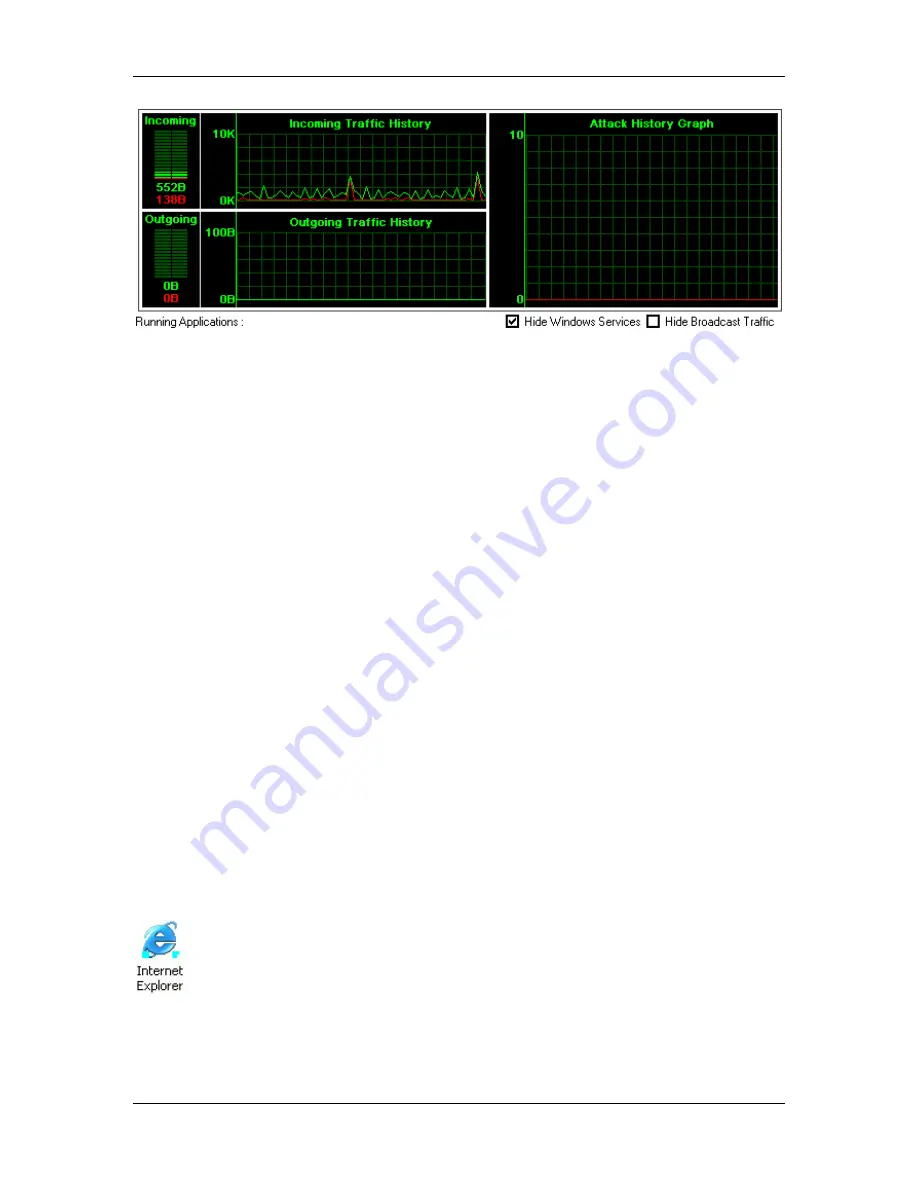
Figure 2. Traffic History Graph
The Traffic History graphs are broken into three sections. On the left side of the graphs
section are the Incoming and Outgoing Traffic History graphs. These provide a visual
assessment of the current traffic that is entering and leaving your device through a network
interface. This includes traffic that is allowed and traffic that is blocked. The green lines and
bars indicate traffic that is allowed to pass through, and the red coloring indicates traffic that
is being blocked by the Agent.
Additionally, the Attack History graph on the right side of the console provides information
on attempted attacks against your machine.
Broadcast Traffic
Broadcast traffic is network traffic that is sent to every device in a particular subnet, and thus
is not directed specifically to your device. If you do not want to see this traffic, you can
remove it from this graphical view by clicking
Hide Broadcast Traffic
. You will then only
see “unicast” traffic in this graph, which is traffic that directed specifically to your device. To
redisplay broadcast traffic, click to clear
Hide Broadcast Traffic.
Running Applications Field
The Running Applications field provides a list of all applications and system services that are
currently running on your system.
An application icon displays a small blue dot on lower left-hand or right-hand corner to
indicate if it is receiving (left-hand) or sending (right-hand) traffic.
You can hide the display of system services by clicking
Hide Windows Services
above the
Running Applications field. There are a number of services running at any given time, and
5


