--- 6 ---
6-2. Practical Test Data
1) Comparisons in load vs. rotation speed and stator coil temp. rise
The graph below shows the relationship between the rotation speed and the stator coil temperature rise while
varying loads.
The temperature rise of the Model S 18SA (the Model S 15SA is similar) is lower than that of the similar
product C-2.
And the rotation speed of the Model S 18SA (the Model S 15SA is similar) is higher than that of C-2.
This means that the overload durability and efficiency of the Model S 18SA are superior to C-2.
HITACHI
S 18SA
Stator coil tamp. rise
: Burn-out point
Load
HITACHI
S 18SA
Rotation speed of spindle
Rotation speed of spindle (/min)
Stator coil temp
. r
ise (K)
C-2
C-2
0
1000
2000
0
200
400
3000
4000
5000
2) Comparisons in sanding performance
The graph below shows the sanding performances comparing produced particle weight production 15 minutes
of operation.
The sanding performance of the Model S 18SA (the Model S 15SA has a similar level) is higher than that of
C-2.
This means that the efficiency of the Model S 18SA is superior to C-2.
HITACHI
S 18SA
C-2
Sanding amount (grams)
0
5
10
15
20
25
30
123 % against C-2
[Test conditions]
•
Sandpaper: Grit #C-P36
•
Material sanded: Mild steel
•
Thrust force: Empty 1.5 kg
Summary of Contents for S 15SA
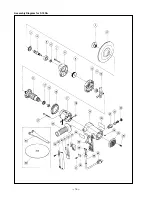
Page 16: ... 13 Assembly Diagram for S 15SA ...


